5.10 Adding Marginal Rugs to a Scatter Plot
5.10.2 Solution
Use geom_rug(). For this example (Figure 5.28), we’ll use the faithful data set. This data set has two columns with data about the Old Faithful geyser: eruptions, which is the length of each eruption, and waiting, which is the length of time until the next eruption:
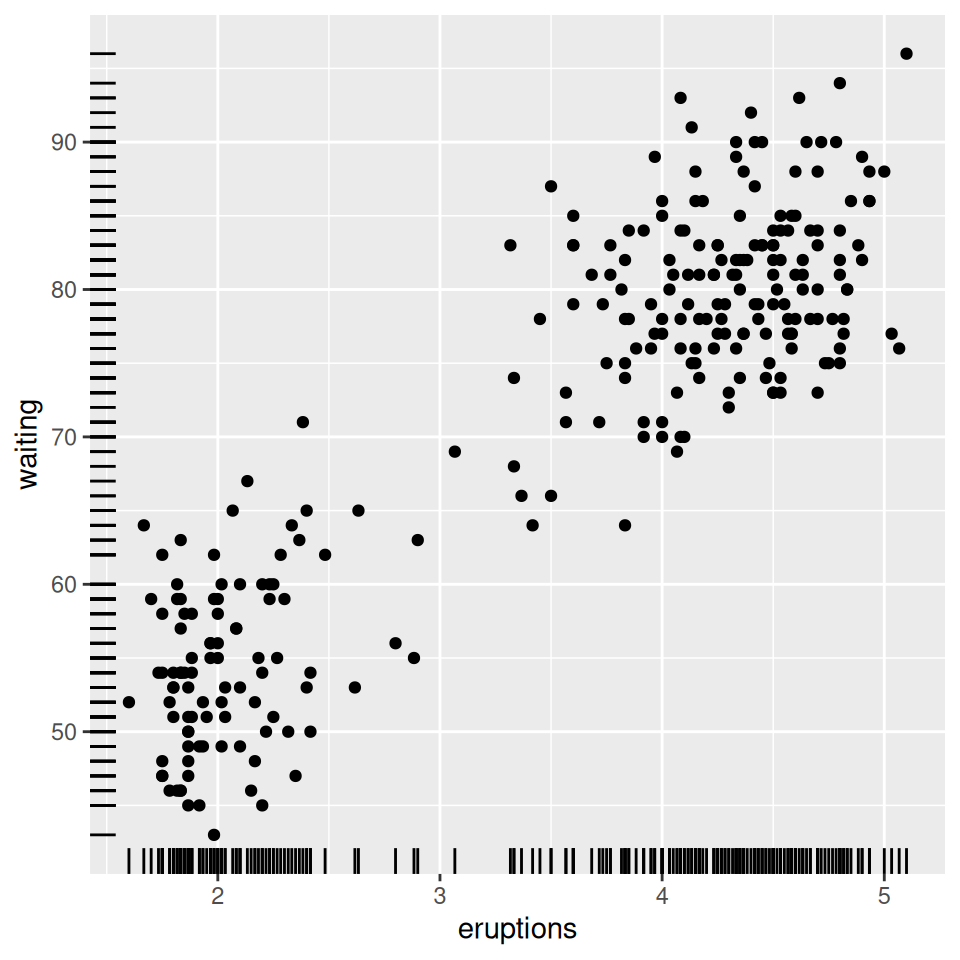
Figure 5.28: Marginal rug added to a scatter plot
5.10.3 Discussion
A marginal rug plot is essentially a one-dimensional scatter plot that can be used to visualize the distribution of data on each axis.
In this particular data set, the marginal rug is not as informative as it could be. The resolution of the waiting variable is in whole minutes, and because of this, the rug lines have a lot of overplotting. To reduce overplotting, we can jitter the line positions and make them slightly thinner by specifying size (Figure 5.29). This helps the viewer see the distribution more clearly:
ggplot(faithful, aes(x = eruptions, y = waiting)) +
  geom_point() +
  geom_rug(position = "jitter", size = 0.2)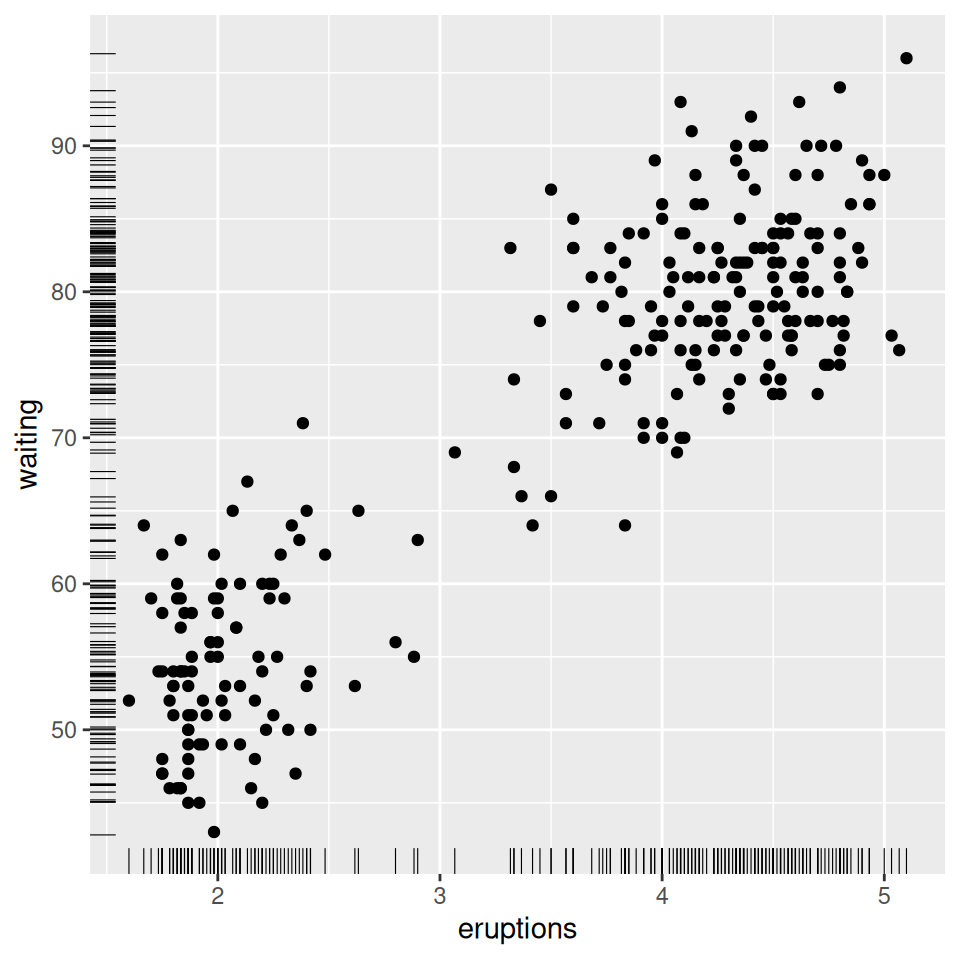
Figure 5.29: Marginal rug with thinner, jittered lines
5.10.4 See Also
For more about overplotting, see Recipe 5.5.