7.6 Highlighting an Item
7.6.2 Solution
To highlight one or more items, create a new column in the data and map it to the color. In this example, we’ll create a copy of the PlantGrowth data set called pg_mod and create a new column, hl, which is set to no if the case was in the control group or treatment 1 group, and set to yes if the case was in the treatment 2 group:
library(dplyr)

pg_mod <- PlantGrowth %>%
  mutate(hl = recode(group, "ctrl" = "no", "trt1" = "no", "trt2" = "yes"))
Then we’ll plot this data with specified colors, and hiding the legend (Figure 7.13):
ggplot(pg_mod, aes(x = group, y = weight, fill = hl)) +
  geom_boxplot() +
  scale_fill_manual(values = c("grey85", "#FFDDCC"), guide = FALSE)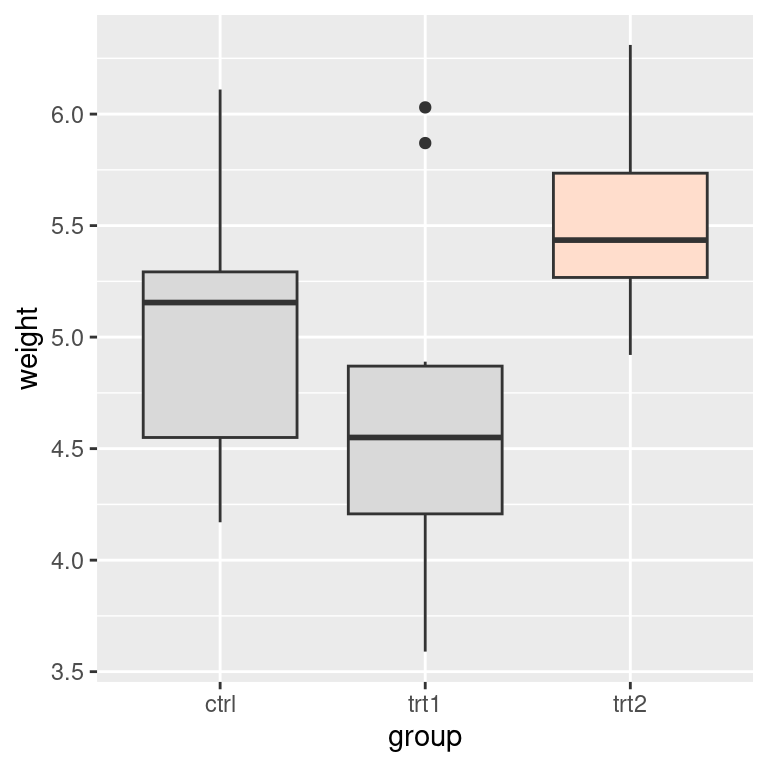
Figure 7.13: Highlighting one item
7.6.3 Discussion
If you have a small number of items, as in this example, instead of creating a new column you could use the original one and specify the colors for every level of that variable. For example, the following code will use the group column from PlantGrowth and manually set the colors for each of the three levels. The result will appear the same as with the preceding code: