6.7 Adding Notches to a Box Plot
6.7.2 Solution
Use geom_boxplot() and set notch = TRUE (Figure
6.20):
library(MASS) # Load MASS for the birthwt data set

ggplot(birthwt, aes(x = factor(race), y = bwt)) +
  geom_boxplot(notch = TRUE)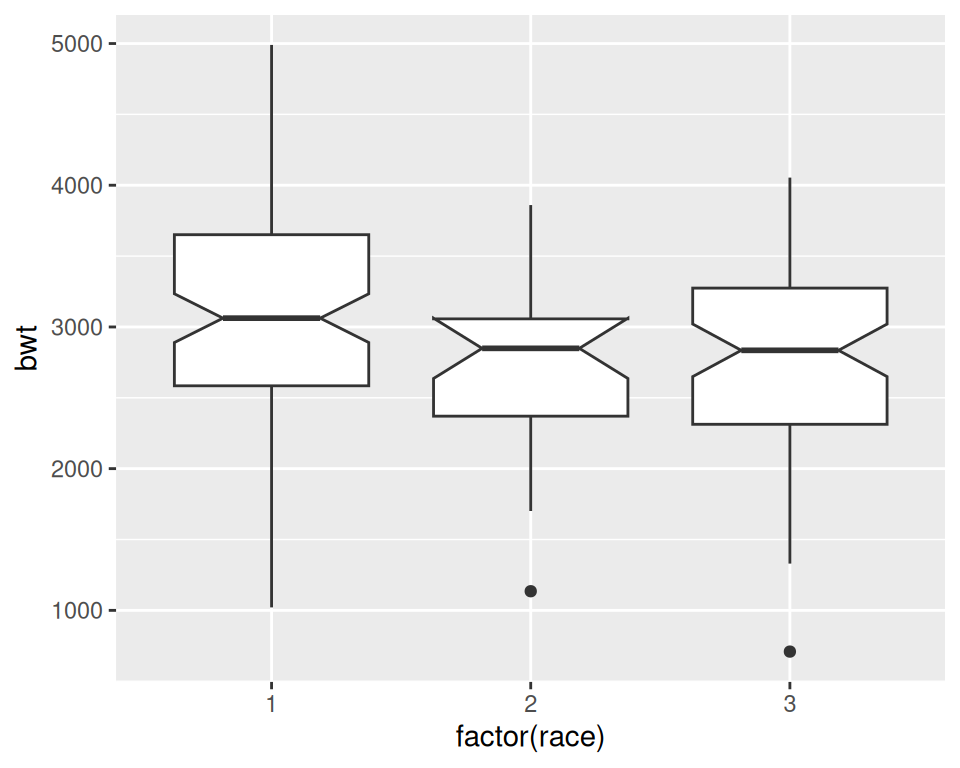
Figure 6.20: A notched box plot
6.7.3 Discussion
Notches are used in box plots to help visually assess whether the medians of distributions differ. If the notches do not overlap, this is evidence that the medians are different.
With this particular data set, you’ll see the following message:
Notch went outside hinges. Try setting notch=FALSE.This means that the confidence region (the notch) went past the bounds (or hinges) of one of the boxes. In this case, the upper part of the notch in the middle box goes just barely outside the box body, but it’s by such a small amount that you can’t see it in the final output. There’s nothing inherently wrong with a notch going outside the hinges, but it can look strange in more extreme cases.