10.8 Changing the Labels in a Legend
10.8.2 Solution
Set the labels in the scale (Figure 10.13, left):
10.8.3 Discussion
Note that the labels on the x-axis did not change. To do that, you would have to set the labels of scale_x_discrete() (Recipe 8.10), or change the data to have different factor level names (Recipe 15.10).
In the preceding example, group was mapped to the fill aesthetic. By default this uses scale_fill_discrete(), which maps the factor levels to colors that are equally spaced around the color wheel (the same as scale_fill_hue()). There are other fill scales we could use, and setting the labels works the same way. For example, to produce the graph on the right in Figure 10.13:
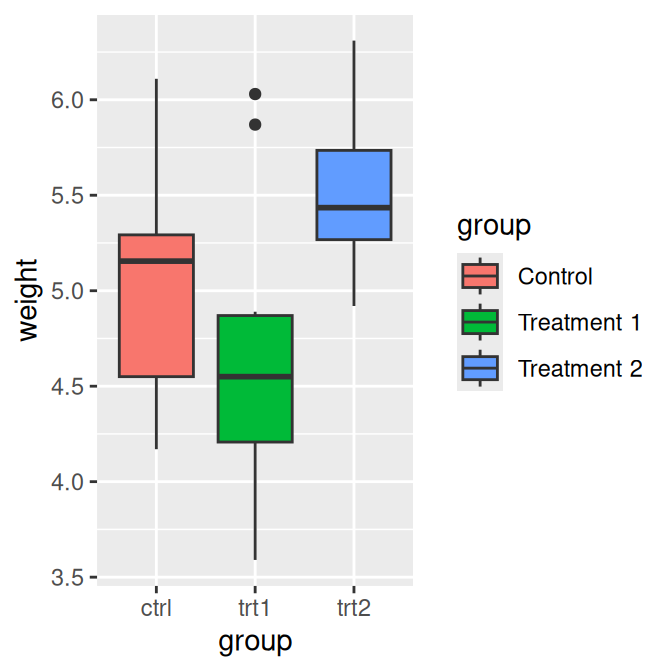
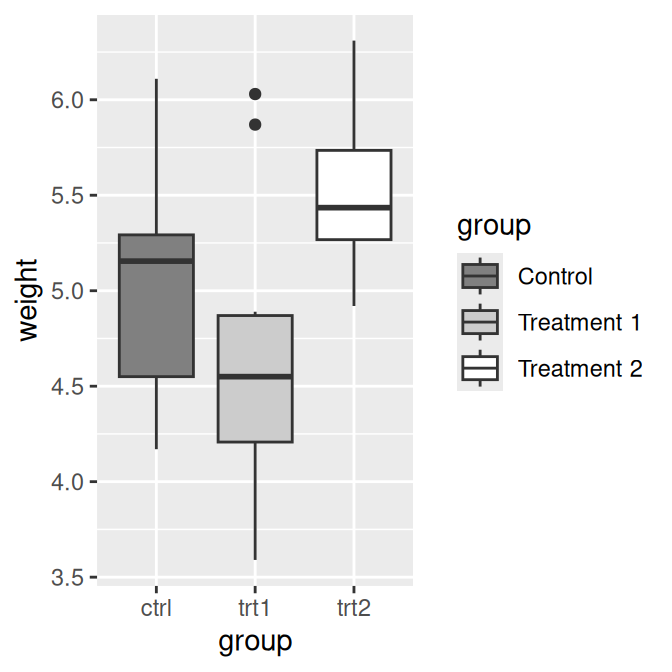
Figure 10.13: Manually specified legend labels with the default discrete scale (left); Manually specified labels with a different scale (right)
If you are also changing the order of items in the legend, the labels are matched to the items by position. In this example we’ll change the item order, and make sure to set the labels in the same order (Figure 10.14):
pg_plot +
  scale_fill_discrete(
    limits = c("trt1", "trt2", "ctrl"),
    labels = c("Treatment 1", "Treatment 2", "Control")
  )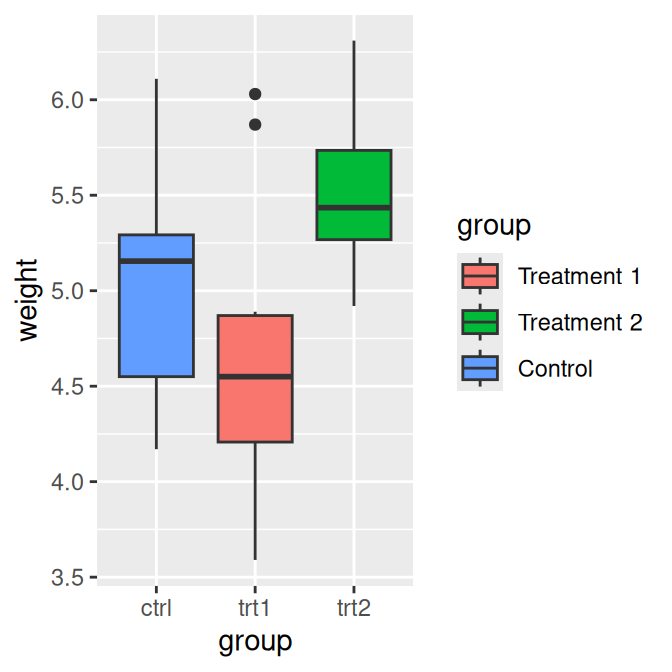
Figure 10.14: Modified legend label order and manually specified labels (note that the x-axis labels and their order are unchanged)
If you have one variable mapped to two separate aesthetics, the default is to have a single legend that combines both. If you want to change the legend labels, you must change them for both scales; otherwise you will end up with two separate legends, as shown in Figure 10.15:
# Create the base plot
hw_plot <- ggplot(heightweight, aes(x = ageYear, y = heightIn, shape = sex, colour = sex)) +
  geom_point()

hw_plot

# Change the labels for one scale
hw_plot +
  scale_shape_discrete(labels = c("Female", "Male"))

# Change the labels for both scales
hw_plot +
  scale_shape_discrete(labels = c("Female", "Male")) +
  scale_colour_discrete(labels = c("Female", "Male"))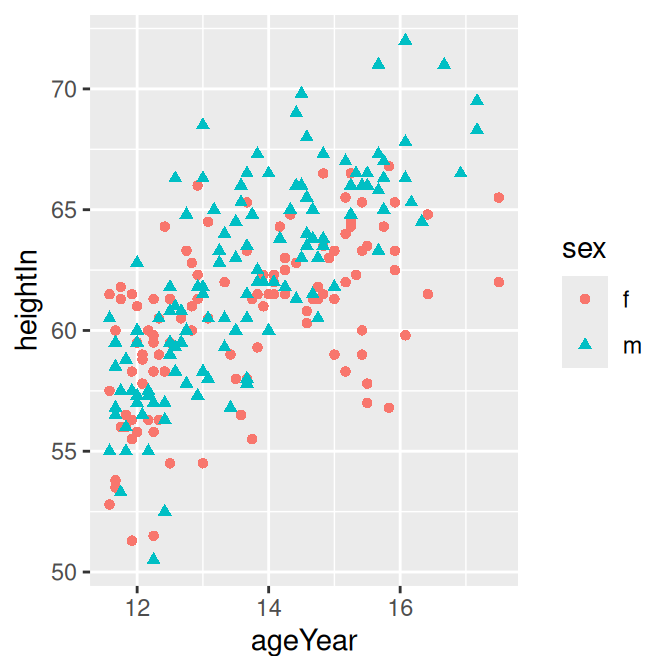
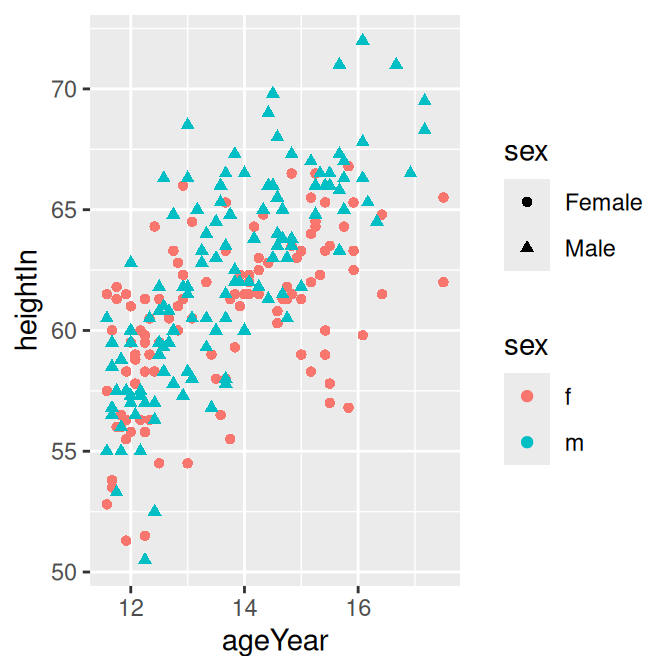
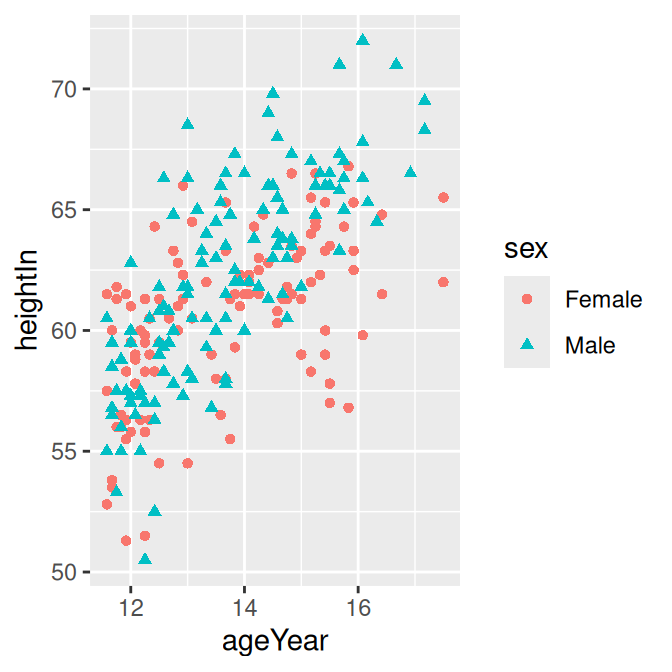
Figure 10.15: A variable mapped to shape and colour (top left); With new labels for shape (top right); With new labels combining both shape and colour` (bottom)
Other commonly used scales with legends include:
scale_fill_discrete()scale_fill_hue()scale_fill_manual()scale_fill_grey()scale_fill_brewer()scale_colour_discrete()scale_colour_hue()scale_colour_manual()scale_colour_grey()scale_color_viridis_c()scale_color_viridis_d()scale_shape_manual()scale_linetype()
By default, using scale_fill_discrete() is equivalent to using scale_fill_hue(); the same is true for color scales.