13.3 Shading a Subregion Under a Function Curve
13.3.2 Solution
Define a new wrapper function around your curve function, and replace out-of-range values with NA, as shown in Figure 13.6:
# Return dnorm(x) for 0 < x < 2, and NA for all other x
dnorm_limit <- function(x) {
    y <- dnorm(x)
    y[x < 0  |  x > 2] <- NA
    return(y)
}

# ggplot() with dummy data
p <- ggplot(data.frame(x = c(-3, 3)), aes(x = x))

p +
  stat_function(fun = dnorm_limit, geom = "area", fill = "blue", alpha = 0.2) +
  stat_function(fun = dnorm)
#> Warning: Removed 67 rows containing missing values or values outside the scale range
#> (`geom_area()`).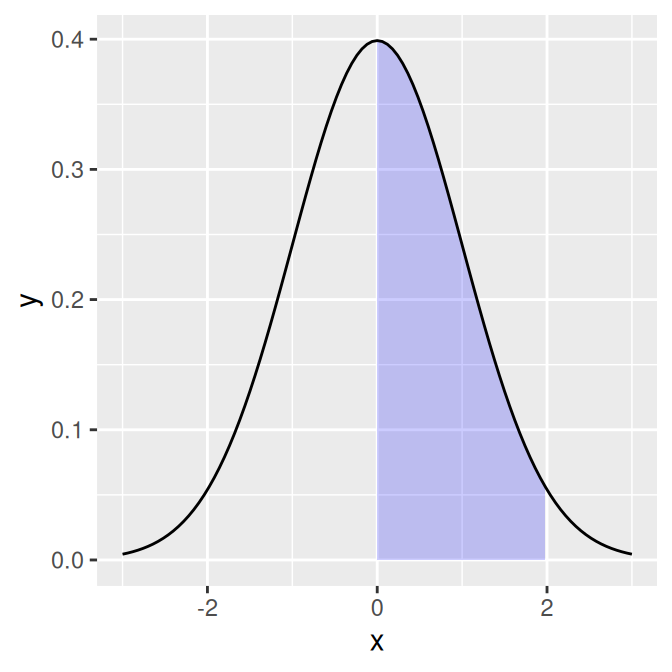
Figure 13.6: Function curve with a shaded region
Remember that what gets passed to this function is a vector, not individual values. If this function operated on single elements at a time, it might make sense to use an if–else statement to decide what to return, conditional on the value of x. But that won’t work here, since x is a vector with many values.
13.3.3 Discussion
R has first-class functions, and we can write a function that returns a closure-that is, we can program a function to program another function.
This function will allow you to pass in a function, a minimum value, and a maximum value. Values outside the range will again be returned with NA:
limitRange <- function(fun, min, max) {
  function(x) {
    y <- fun(x)
    y[x < min  |  x > max] <- NA
    return(y)
  }
}
Now we can call this function to create another function – one that is effectively the same as the dnorm_limit() function used earlier:
# This returns a function
dlimit <- limitRange(dnorm, 0, 2)
# Now we'll try out the new function -- it only returns values for inputs
# between 0 and 2
dlimit(-2:4)
#> [1]         NA         NA 0.39894228 0.24197072 0.05399097         NA
#> [7]         NA
We can use limitRange() to create a function that is passed to stat_function():
p +
  stat_function(fun = dnorm) +
  stat_function(fun = limitRange(dnorm, 0, 2), geom = "area", fill = "blue",
                alpha = 0.2)
The limitRange() function can be used with any function, not just dnorm(), to create a range-limited version of that function. The result of all this is that instead of having to write functions with different hard-coded values for each situation that arises, we can write one function and simply pass it different arguments depending on the situation.
If you look very, very closely at the graph in Figure 13.6, you may see that the shaded region does not align exactly with the range we specified. This is because ggplot2 does a numeric approximation by calculating values at fixed intervals, and these intervals may not fall exactly within the specified range. As in Recipe 13.2, we can improve the approximation by increasing the number of interpolated values with stat_function(n = 200).