12.2 Representing Variables with Colors
12.2.2 Solution
In the call to the geom, inside of aes(), set the value of colour or fill to the name of one of the columns in the data (Figure 12.2):
library(gcookbook)  # Load gcookbook for the cabbage_exp data set

# These both have the same effect
ggplot(cabbage_exp, aes(x = Date, y = Weight, fill = Cultivar)) +
  geom_col(colour = "black", position = "dodge")

ggplot(cabbage_exp, aes(x = Date, y = Weight)) +
  geom_col(aes(fill = Cultivar), colour = "black", position = "dodge")

# These both have the same effect
ggplot(mtcars, aes(x = wt, y = mpg, colour = cyl)) +
  geom_point()

ggplot(mtcars, aes(x = wt, y = mpg)) +
  geom_point(aes(colour = cyl))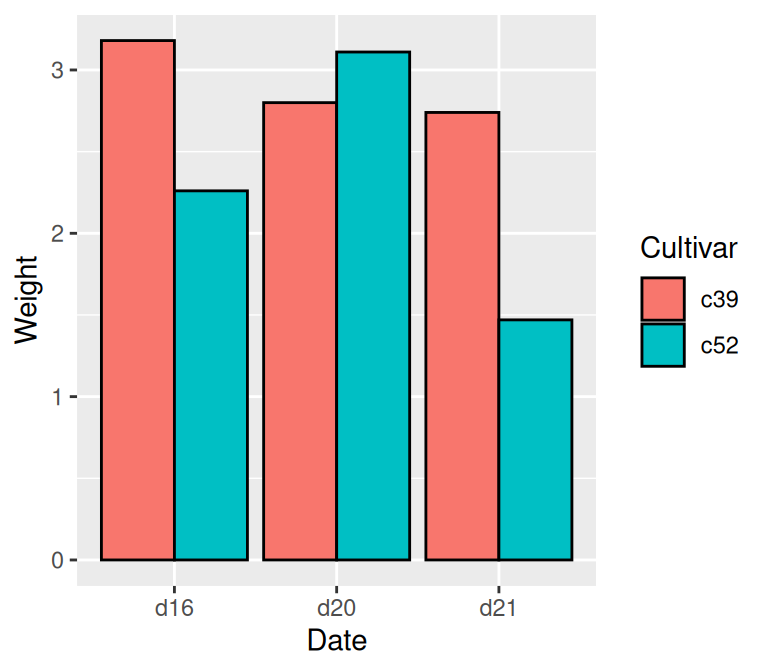
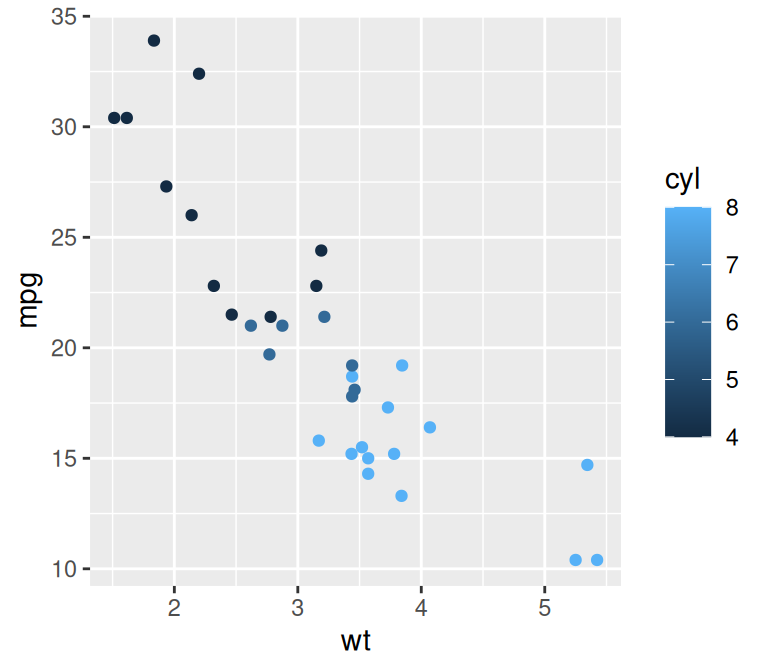
Figure 12.2: Mapping a variable to fill (left); Mapping a variable to colour for points (right)
When the mapping is specified in ggplot() it is used as the default mapping, which is inherited by all the geoms. Within a geom, the default mappings can be overridden.
12.2.3 Discussion
In the cabbage_exp example, the variable Cultivar is mapped to fill. The Cultivar column in cabbage_exp is a factor, so ggplot treats it as a categorical variable. You can check the type using str():
str(cabbage_exp)
#> 'data.frame':    6 obs. of  6 variables:
#>  $ Cultivar: Factor w/ 2 levels "c39","c52": 1 1 1 2 2 2
#>  $ Date    : Factor w/ 3 levels "d16","d20","d21": 1 2 3 1 2 3
#>  $ Weight  : num  3.18 2.8 2.74 2.26 3.11 1.47
#>  $ sd      : num  0.957 0.279 0.983 0.445 0.791 ...
#>  $ n       : int  10 10 10 10 10 10
#>  $ se      : num  0.3025 0.0882 0.311 0.1408 0.2501 ...
In the mtcars example, cyl is numeric, so it is treated as a continuous variable. Because of this, even though the actual values of cyl include only 4, 6, and 8, the legend has entries for the intermediate values 5 and 7. To make ggplot treat cyl as a categorical variable, you can convert it to a factor in the call to ggplot() (Figure 12.3, left), or you can modify the data so that the column is a character vector or factor (Figure 12.3, right):
# Convert to factor in call to ggplot()
ggplot(mtcars, aes(x = wt, y = mpg, colour = factor(cyl))) +
  geom_point()

# Another method: Convert to factor in the data
library(dplyr)
mtcars_mod <- mtcars %>%
  mutate(cyl = as.factor(cyl))  # Convert cyl to a factor

ggplot(mtcars_mod, aes(x = wt, y = mpg, colour = cyl)) +
  geom_point()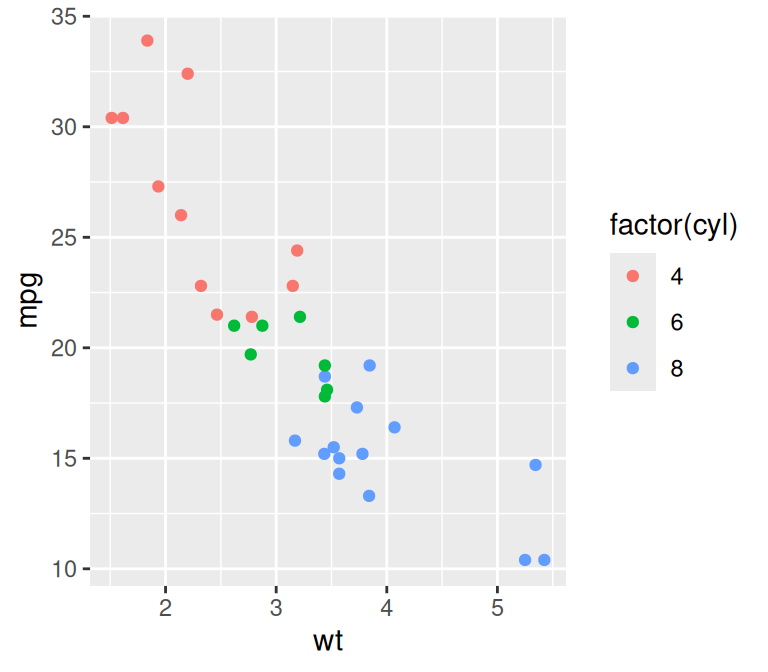
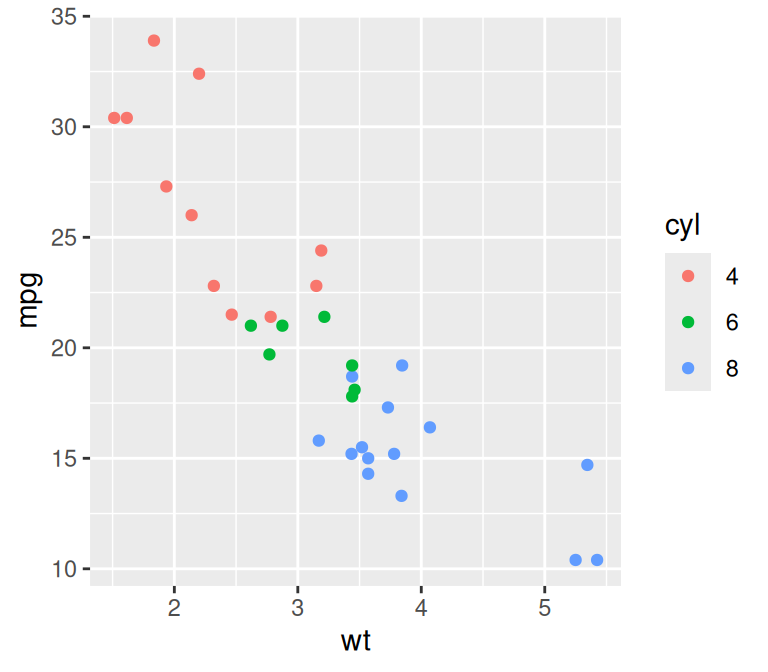
Figure 12.3: Converting cyl to a factor, within the call to ggplot (left); By modifying the dataframe (right)