2.2 Creating a Line Graph
2.2.2 Solution
To make a line graph using plot() (Figure 2.3, left), pass it a vector of x values and a vector of y values, and use type = "l":
plot(pressure$temperature, pressure$pressure, type = "l")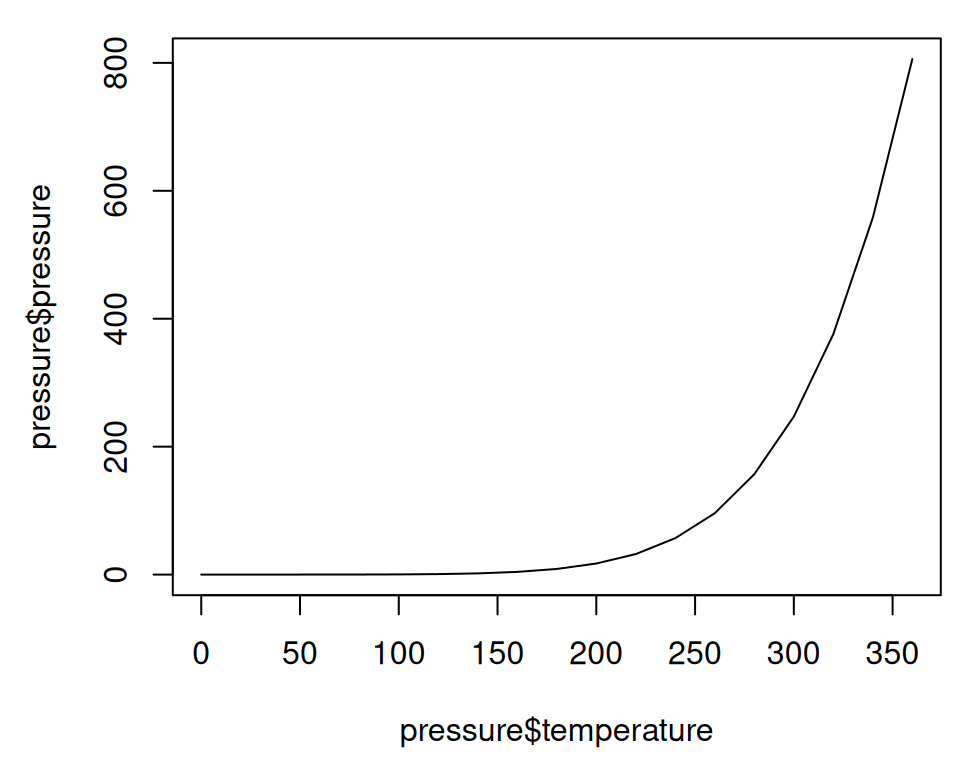
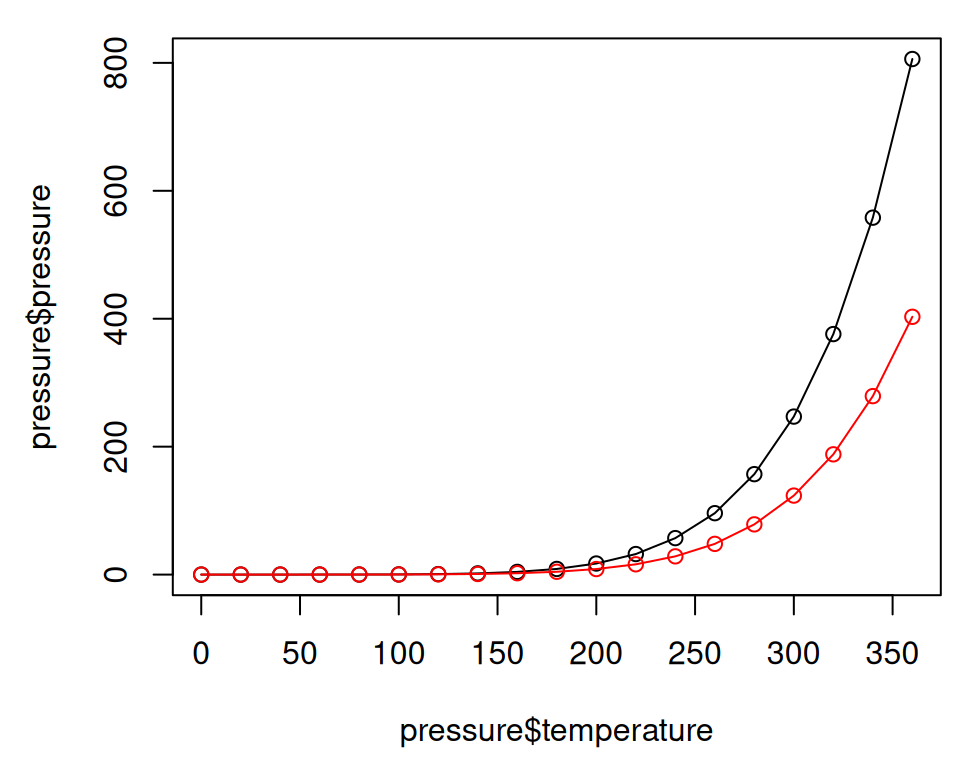
Figure 2.3: Line graph with base graphics (left); With points and another line (right)
To add points and/or multiple lines (Figure 2.3, right), first call plot() for the first line, then add points with points() and additional lines with lines():
plot(pressure$temperature, pressure$pressure, type = "l")
points(pressure$temperature, pressure$pressure)

lines(pressure$temperature, pressure$pressure/2, col = "red")
points(pressure$temperature, pressure$pressure/2, col = "red")
With ggplot2, you can get a similar result using geom_line() (Figure 2.4):
library(ggplot2)
ggplot(pressure, aes(x = temperature, y = pressure)) +
  geom_line()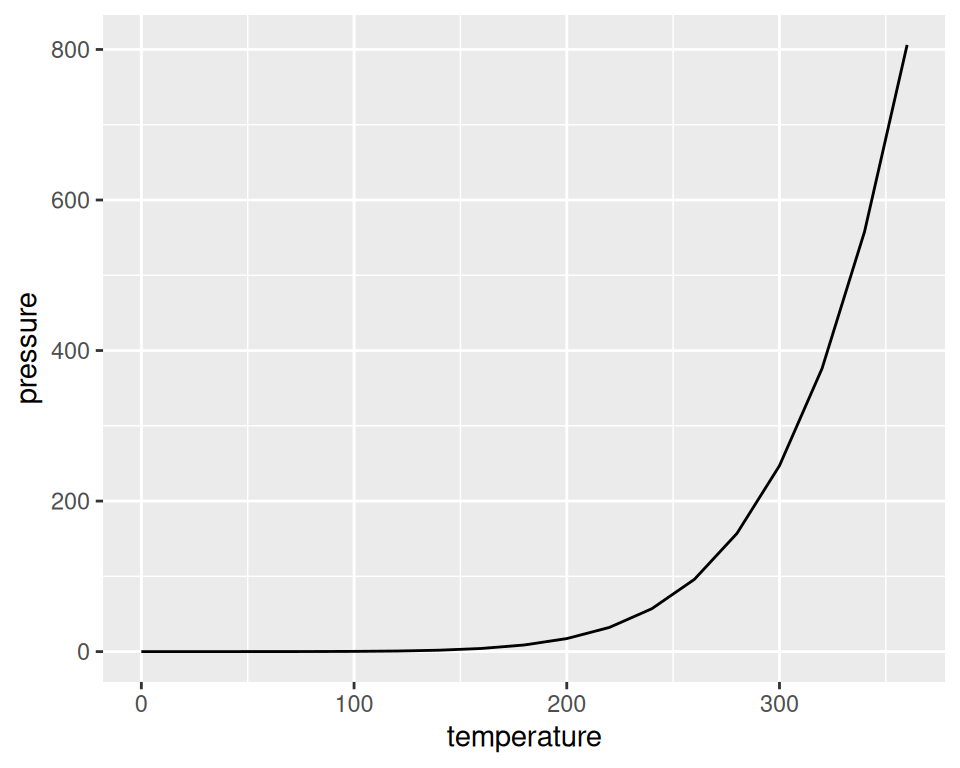
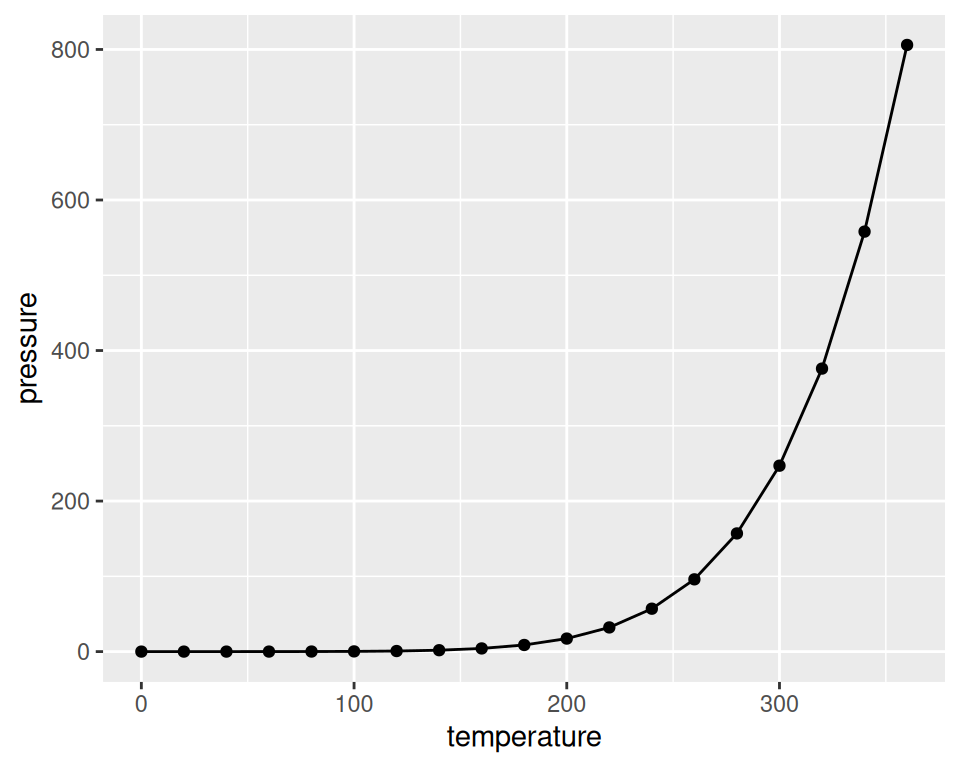
Figure 2.4: Line graph with ggplot() (left); With points added (right)
As with scatter plots, you can pass you data in vectors instead of in a data frame (but this will limit the things you can do later with the plot):
ggplot(pressure, aes(x = temperature, y = pressure)) +
  geom_line() +
  geom_point()
Note
It’s common with
ggplot()to split the command on multiple lines, ending each line with a+so that R knows that the command will continue on the next line.
2.2.3 See Also
See Chapter 4 for more in-depth information about creating line graphs.