7.1 Adding Text Annotations
7.1.2 Solution
Use annotate() and a text geom (Figure 7.1):
p <- ggplot(faithful, aes(x = eruptions, y = waiting)) +
  geom_point()

p +
  annotate("text", x = 3, y = 48, label = "Group 1") +
  annotate("text", x = 4.5, y = 66, label = "Group 2")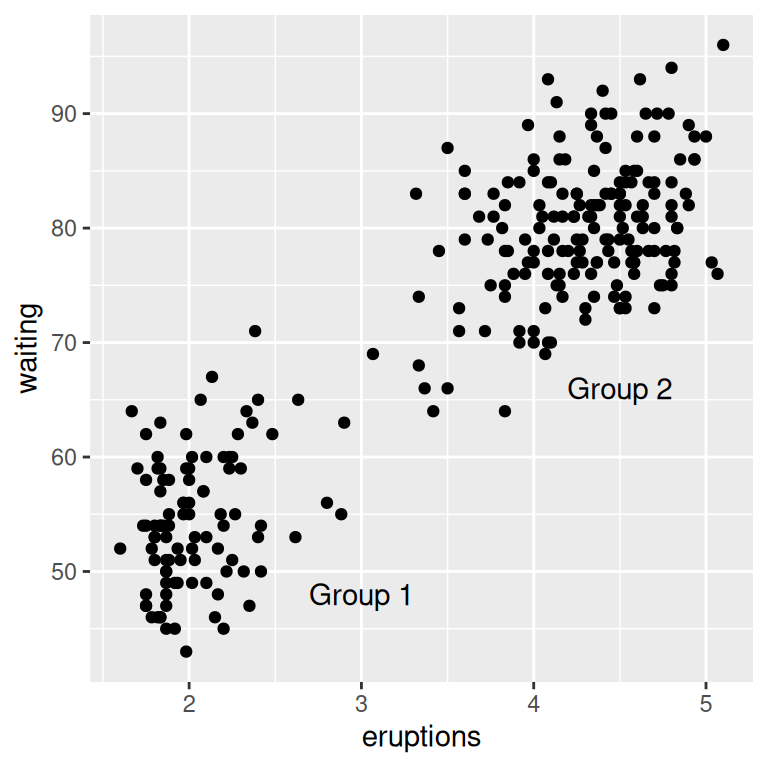
Figure 7.1: Text annotations
7.1.3 Discussion
The annotate() function can be used to add any type of geometric object. In this case, we used geom = "text".
Other text properties can be specified, as shown in Figure 7.2:
p +
  annotate("text", x = 3, y = 48, label = "Group 1",
           family = "serif", fontface = "italic", colour = "darkred", size = 3) +
  annotate("text", x = 4.5, y = 66, label = "Group 2",
           family = "serif", fontface = "italic", colour = "darkred", size = 3)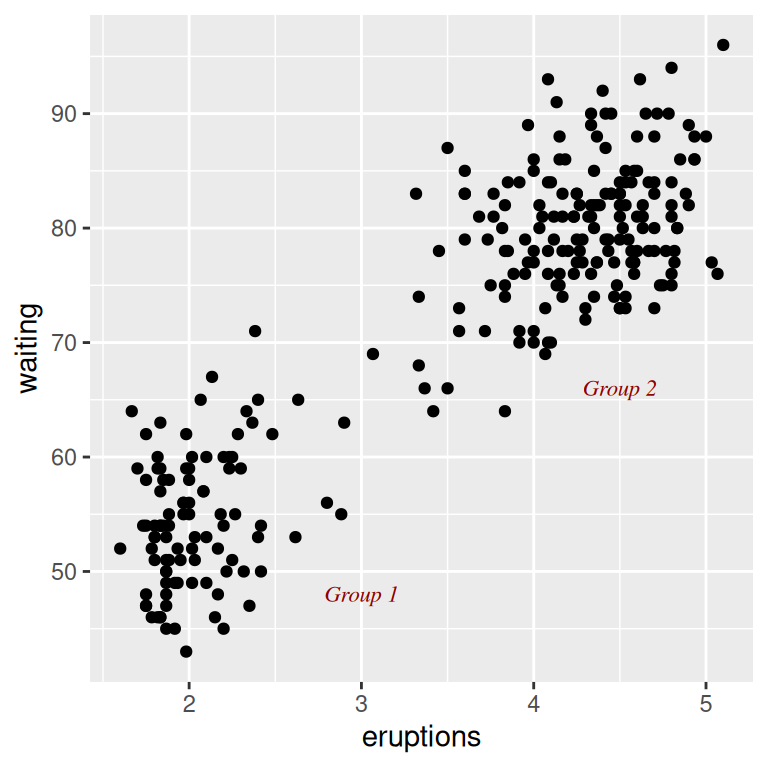
Figure 7.2: Modified text properties
Be careful not to use geom_text() when you want to add individual text objects. While annotate(geom = "text") will add a single text object to the plot, geom_text() will create many text objects based on the data, as discussed in Recipe 5.11.
If you use geom_text(), the text will be heavily overplotted on the same location, with one copy per data point:
p +
  # Normal
  annotate("text", x = 3, y = 48, label = "Group 1", alpha = .1) +
  # Overplotted
  geom_text(x = 4.5, y = 66, label = "Group 2", alpha = .1)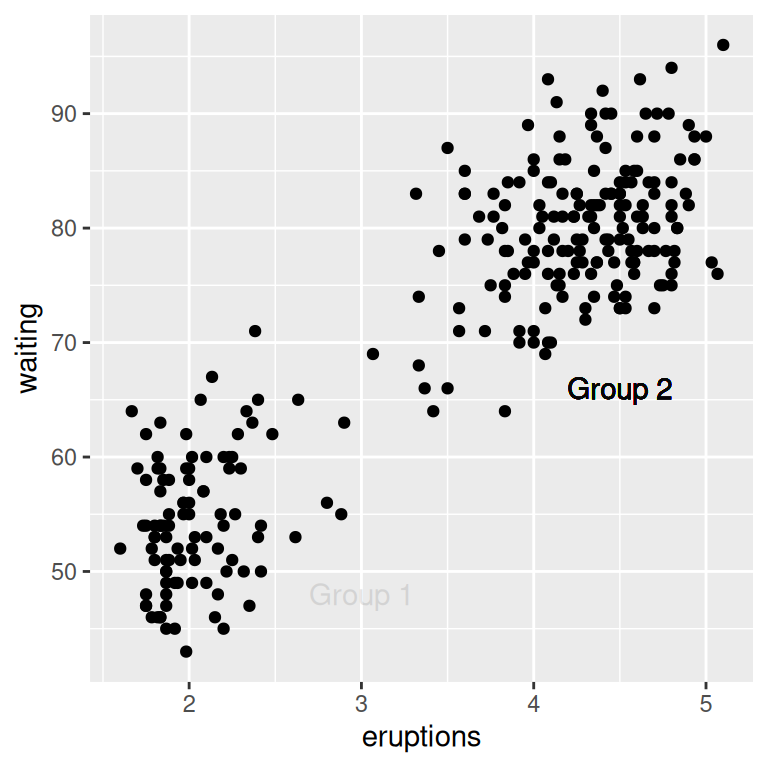
Figure 7.3: Overplotting one of the labels – both should be 90% transparent
In Figure 7.3, each text label is 90% transparent, making it clear which one is overplotted. The overplotting can lead to output with aliased (jagged) edges when outputting to a bitmap.
If the axes are continuous, you can use the special values Inf and -Inf to place text annotations at the edge of the plotting area, as shown in Figure 7.4. You will also need to adjust the position of the text relative to the corner using hjust and vjust – if you leave them at their default values, the text will be centered on the edge. It may take a little experimentation with these values to get the text positioned to your liking:
p +
  annotate("text", x = -Inf, y = Inf, label = "Upper left", hjust = -.2, vjust = 2) +
  annotate("text", x = mean(range(faithful$eruptions)), y = -Inf, vjust = -0.4,
           label = "Bottom middle")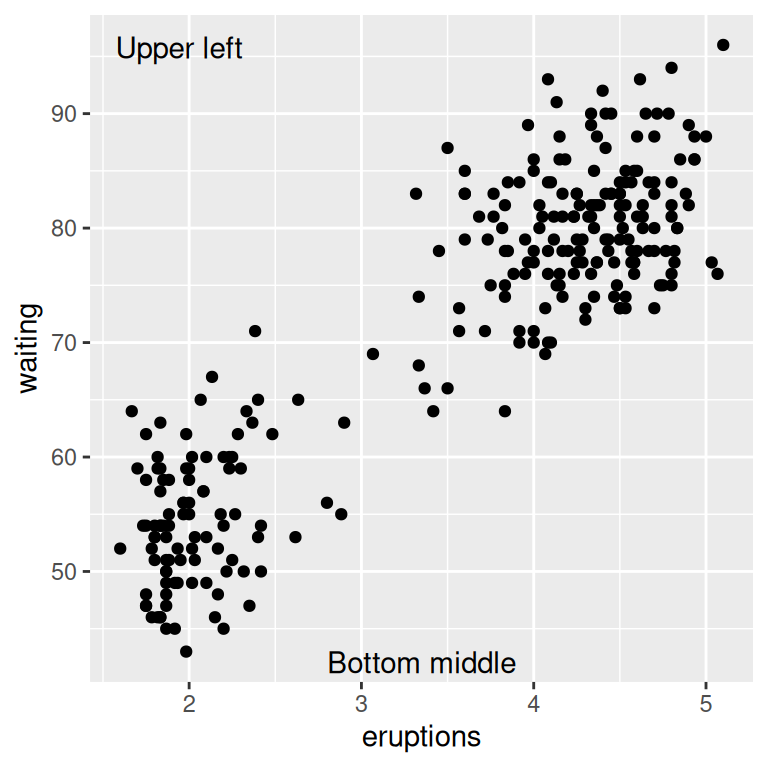
Figure 7.4: Text positioned at the edge of the plotting area