5.3 Using Different Point Shapes
5.3.2 Solution
You can set the shape of all the data points at once (Figure 5.5, left) by setting a shape in geom_point():
library(gcookbook) # Load gcookbook for the heightweight data set

ggplot(heightweight, aes(x = ageYear, y = heightIn)) +
  geom_point(shape = 3)
If you have mapped a variable to shape, you can use scale_shape_manual() to manually change the shapes mapped to the levels of that variable:
# Use slightly larger points and use custom values for the shape scale
ggplot(heightweight, aes(x = ageYear, y = heightIn, shape = sex)) +
  geom_point(size = 3) +
  scale_shape_manual(values = c(1, 4))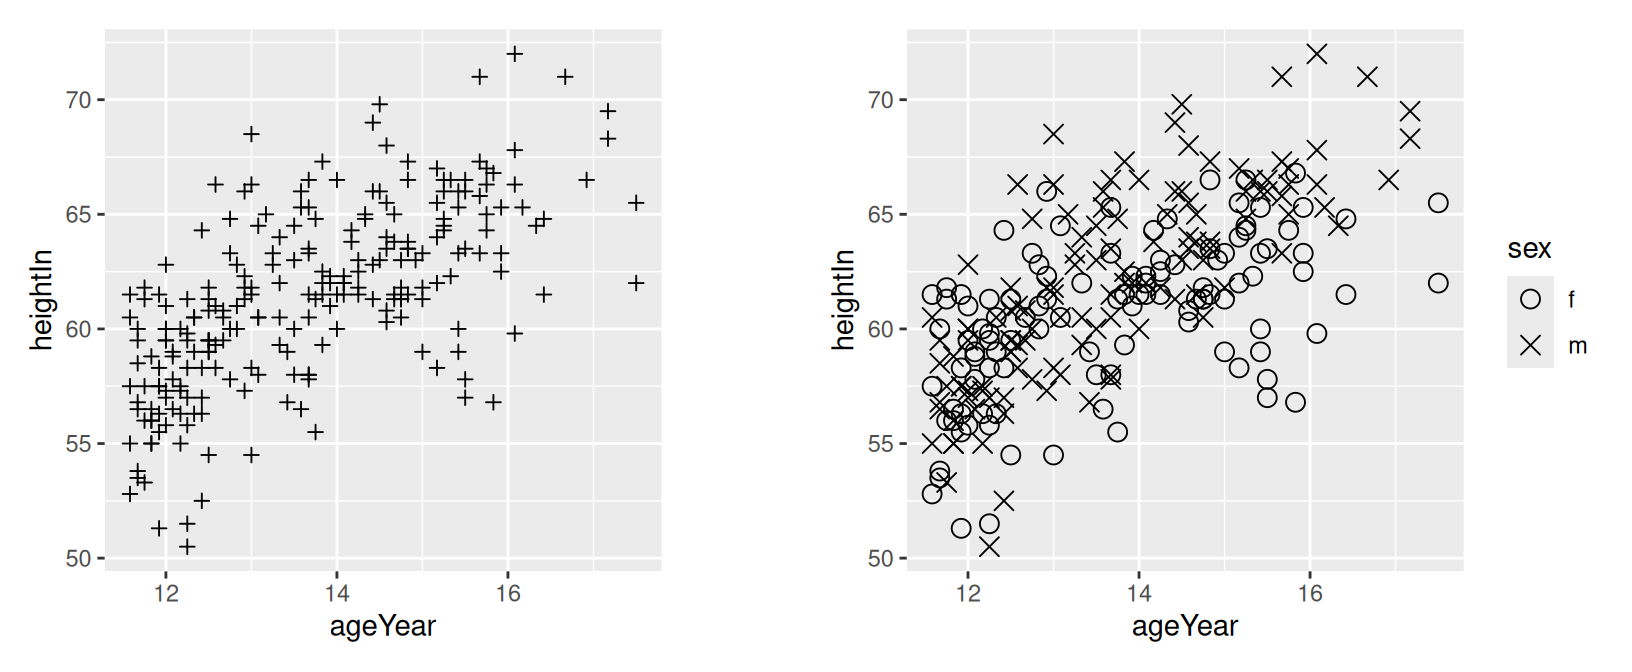
Figure 5.5: Scatter plot with the shape aesthetic set to a custom value (left); With a variable mapped to shape, using a custom shape palette (right)
5.3.3 Discussion
Figure 5.6 shows the shapes that are already built into R. Some of the point shapes (1–14) only have an outline; some (15–20) have solid fill; and some (21–25) have an outline and fill that can be controlled separately. You can also use characters for points.
For shapes 1–20, the color of the entire point – even the points that have solid fill – is controlled by the colour aesthetic. For shapes 21–25, the outline is controlled by colour and the fill is controlled by fill.
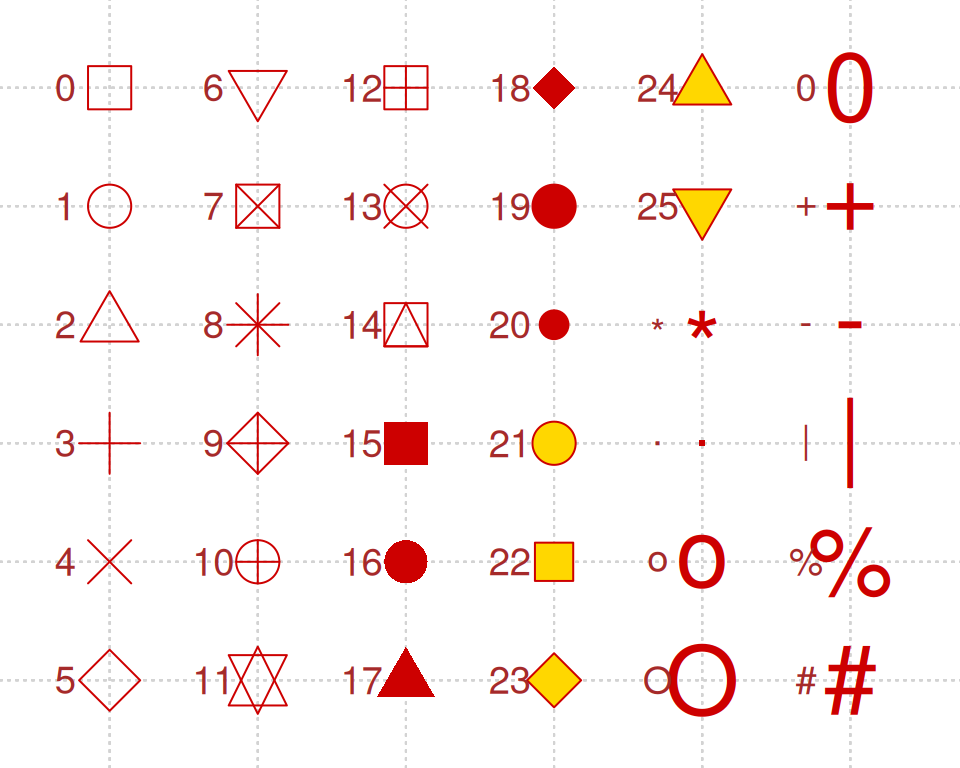
Figure 5.6: Shapes in R graphics
It’s possible to have one variable represented by the shape of a point, and and another variable represented by the fill (empty or filled) of the point. To do this, you need to first choose point shapes that have both colour and fill, and set these in scale_shape_manual. You then need to choose a fill palette that includes NA and another color (the NA will result in a hollow shape) and use these in scale_fill_manual().
For example, we’ll take the heightweight data set and add another column that indicates whether the child weighed 100 pounds or more (Figure 5.7):
# Using the heightweight data set, create a new column that indicates if the
# child weighs < 100 or >= 100 pounds. We'll save this modified dataset as 'hw'.
hw <- heightweight %>%
  mutate(weightgroup = ifelse(weightLb < 100, "< 100", ">= 100"))

# Specify shapes with fill and color, and specify fill colors that includes an empty (NA) color
ggplot(hw, aes(x = ageYear, y = heightIn, shape = sex, fill = weightgroup)) +
  geom_point(size = 2.5) +
  scale_shape_manual(values = c(21, 24)) +
  scale_fill_manual(
    values = c(NA, "black"),
    guide = guide_legend(override.aes = list(shape = 21))
  )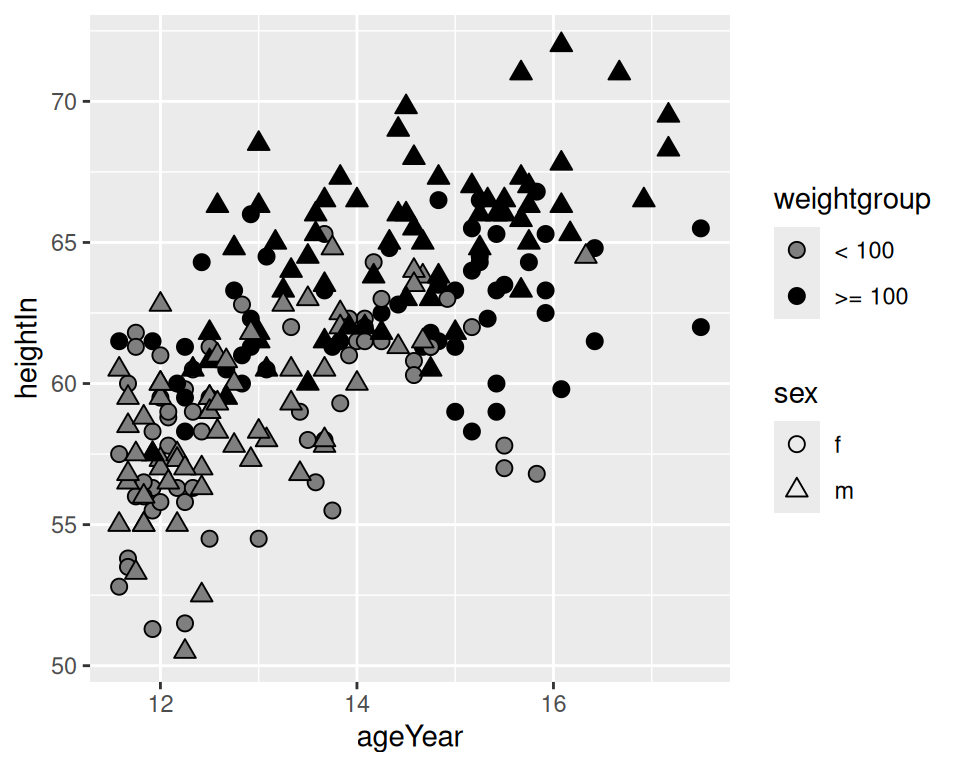
Figure 5.7: A variable mapped to shape and another mapped to fill