8.5 Setting the Scaling Ratio of the X- and Y-Axes
8.5.2 Solution
Use coord_fixed(). This will result in a 1:1 scaling between the x- and y-axes, as shown in Figure 8.10:
library(gcookbook)  # Load gcookbook for the marathon data set

m_plot <- ggplot(marathon, aes(x = Half,y = Full)) +
  geom_point()

m_plot +
  coord_fixed()
8.5.3 Discussion
The marathon data set contains runners’ marathon and half-marathon times. In this case it might be useful to force the x- and y-axes to have the same scaling.
It’s also helpful to set the tick spacing to be the same, by setting breaks in scale_y_continuous() and scale_x_continuous() (also in Figure 8.10):
m_plot +
  coord_fixed() +
  scale_y_continuous(breaks = seq(0, 420, 30)) +
  scale_x_continuous(breaks = seq(0, 420, 30))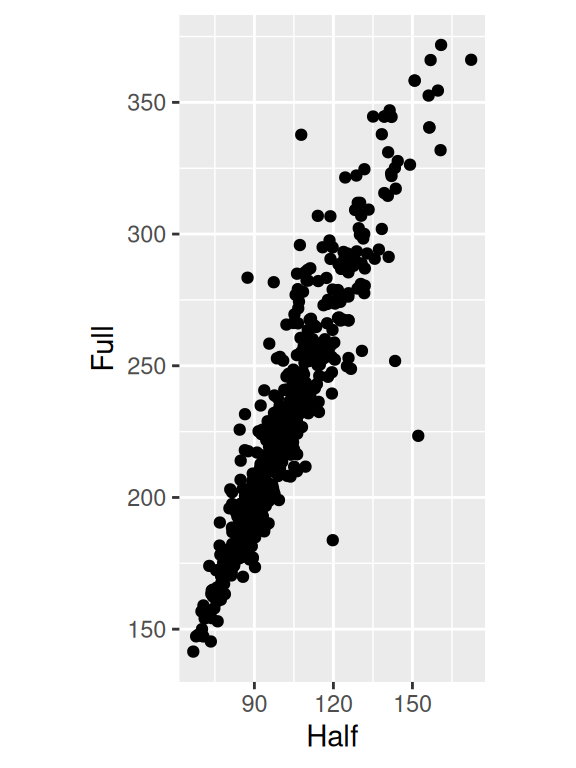
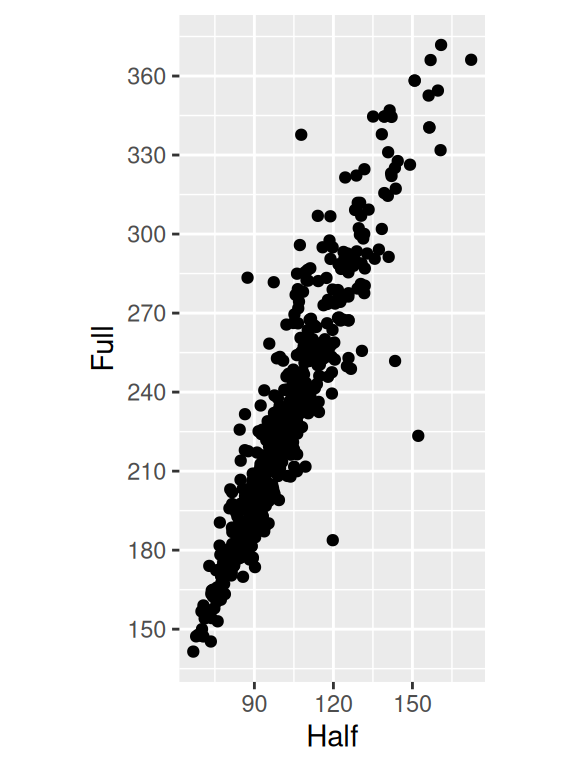
Figure 8.10: Scatter plot with equal scaling of axes (left); With tick marks at specified positions (right)
If, instead of an equal ratio, you want some other fixed ratio between the axes, set the ratio parameter. With the marathon data, we might want the axis with half-marathon times stretched out to twice that of the axis with the marathon times (Figure 8.11). We’ll also add tick marks twice as often on the x-axis:
m_plot +
  coord_fixed(ratio = 1/2) +
  scale_y_continuous(breaks = seq(0, 420, 30)) +
  scale_x_continuous(breaks = seq(0, 420, 15))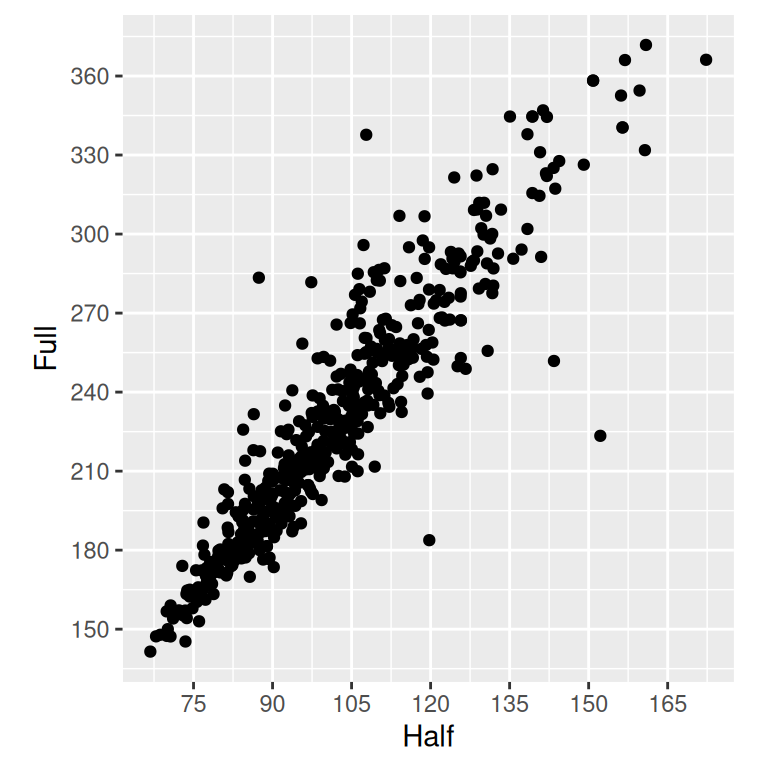
Figure 8.11: Scatter plot with a 1/2 scaling ratio for the axes