3.6 Adjusting Bar Width and Spacing
3.6.2 Solution
To make the bars narrower or wider, set width in geom_col(). The default value is 0.9; larger values make the bars wider, and smaller values make the bars narrower (Figure 3.13).
For example, for standard-width bars:
library(gcookbook) # Load gcookbook for the pg_mean data set

ggplot(pg_mean, aes(x = group, y = weight)) +
  geom_col()
For narrower bars:
ggplot(pg_mean, aes(x = group, y = weight)) +
  geom_col(width = 0.5)
And for wider bars (these have the maximum width of 1):
ggplot(pg_mean, aes(x = group, y = weight)) +
  geom_col(width = 1)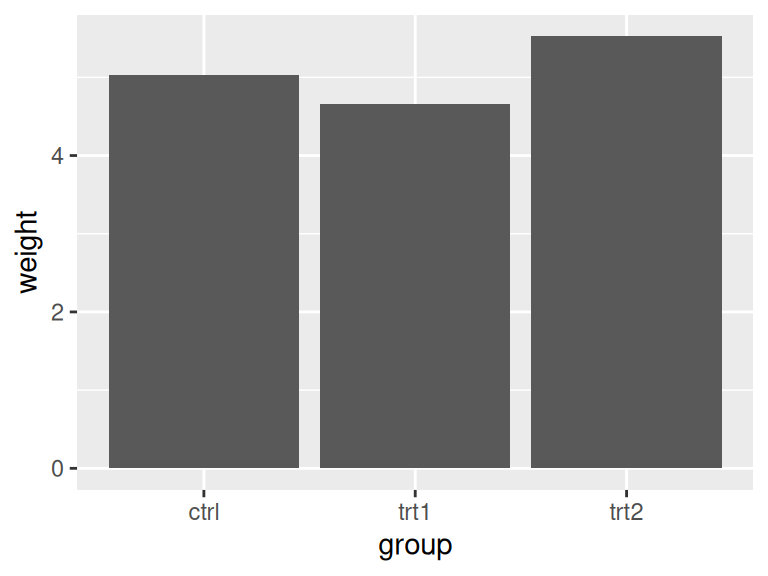
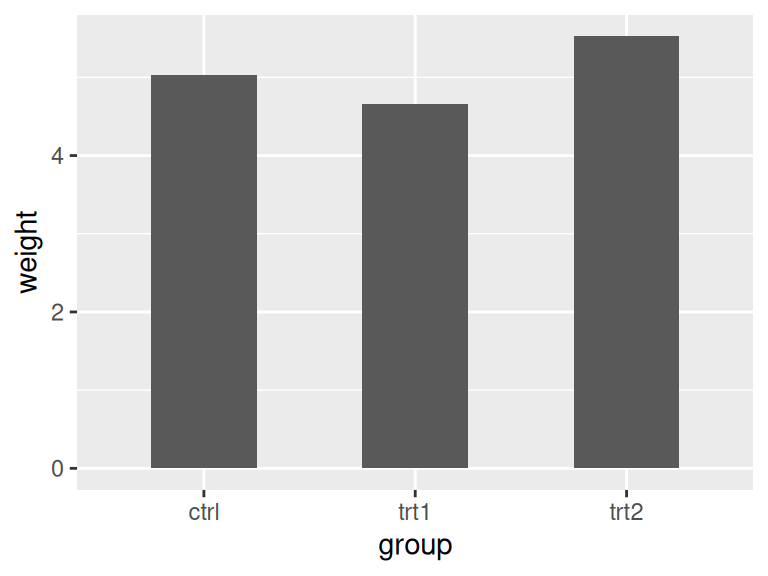
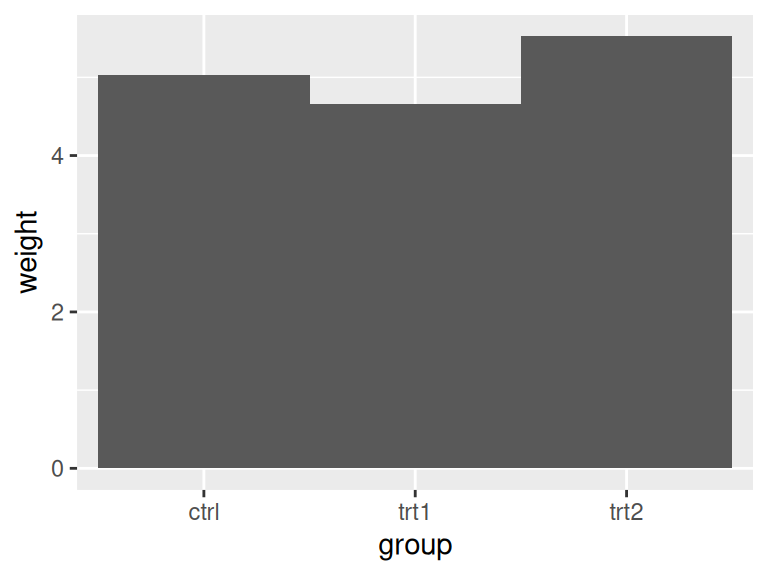
Figure 3.13: Different bar widths
For grouped bars, the default is to have no space between bars within each group. To add space between bars within a group, make width smaller and set the value for position_dodge to be larger than width (Figure 3.14).
For a grouped bar graph with narrow bars:
ggplot(cabbage_exp, aes(x = Date, y = Weight, fill = Cultivar)) +
  geom_col(width = 0.5, position = "dodge")
And with some space between the bars:
ggplot(cabbage_exp, aes(x = Date, y = Weight, fill = Cultivar)) +
  geom_col(width = 0.5, position = position_dodge(0.7))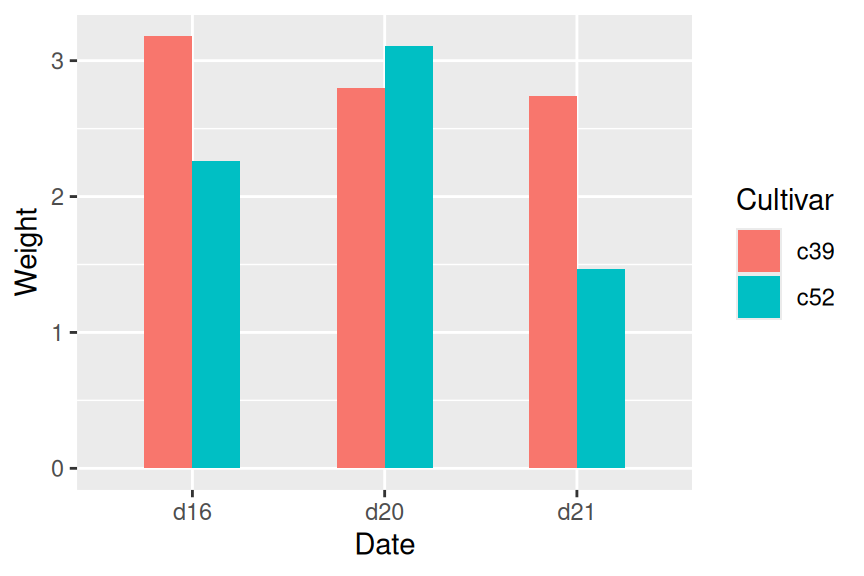
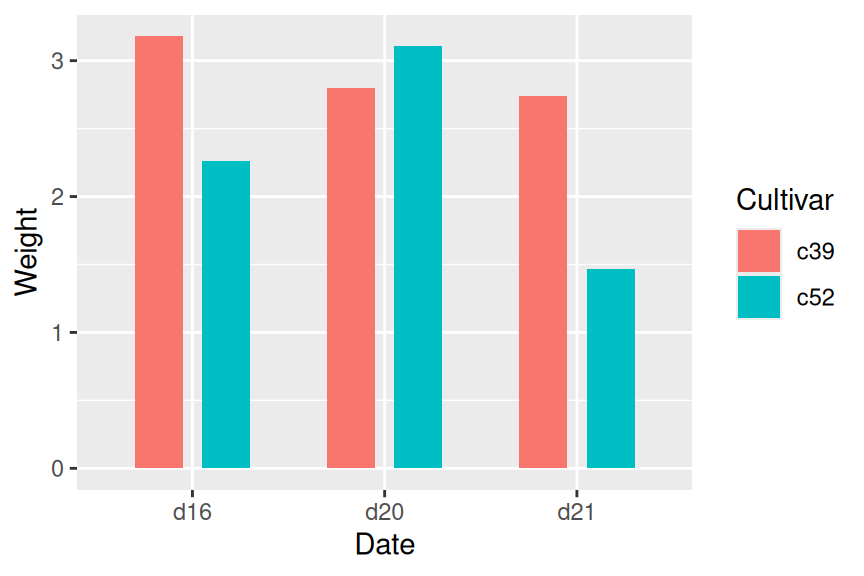
Figure 3.14: Bar graph with narrow grouped bars (left); With space between the bars (right)
The first graph used position = "dodge", and the second graph used position = position_dodge(). This is because position = "dodge" is simply shorthand for position = position_dodge() with the default value of 0.9, but when we want to set a specific value, we need to use the more verbose form.
3.6.3 Discussion
The default width for bars is 0.9, and the default value used for position_dodge() is the same. To be more precise, the value of width in position_dodge() is NULL, which tells ggplot2 to use the same value as the width from geom_bar().
All of these will have the same result:
geom_bar(position = "dodge")
geom_bar(width = 0.9, position = position_dodge())
geom_bar(position = position_dodge(0.9))
geom_bar(width = 0.9, position = position_dodge(width=0.9))
The items on the x-axis have x values of 1, 2, 3, and so on, though you typically don’t refer to them by these numerical values. When you use geom_bar(width = 0.9), it makes each group take up a total width of 0.9 on the x-axis. When you use position_dodge(width = 0.9), it spaces the bars so that the middle of each bar is right where it would be if the bar width were 0.9 and the bars were touching. This is illustrated in Figure 3.15. The two graphs both have the same dodge width of 0.9, but while the top has a bar width of 0.9, the bottom has a bar width of 0.2. Despite the different bar widths, the middles of the bars stay aligned.
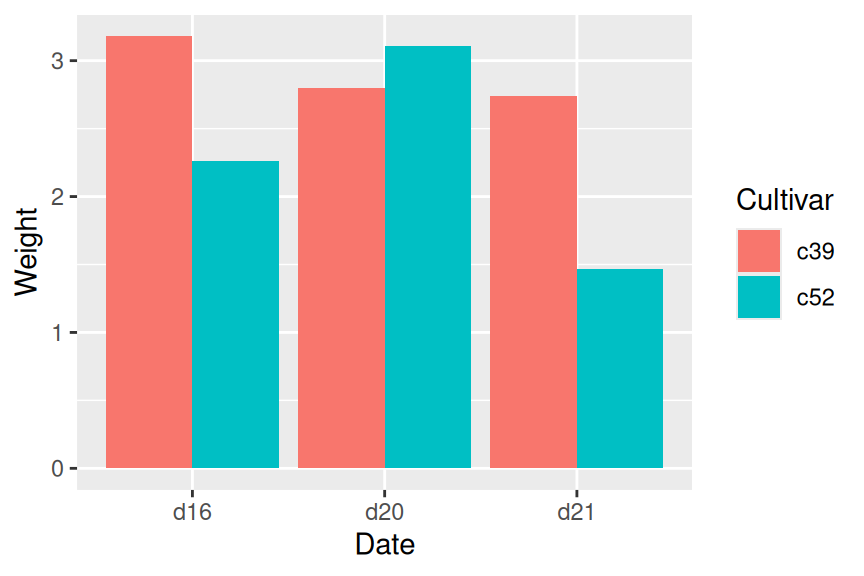
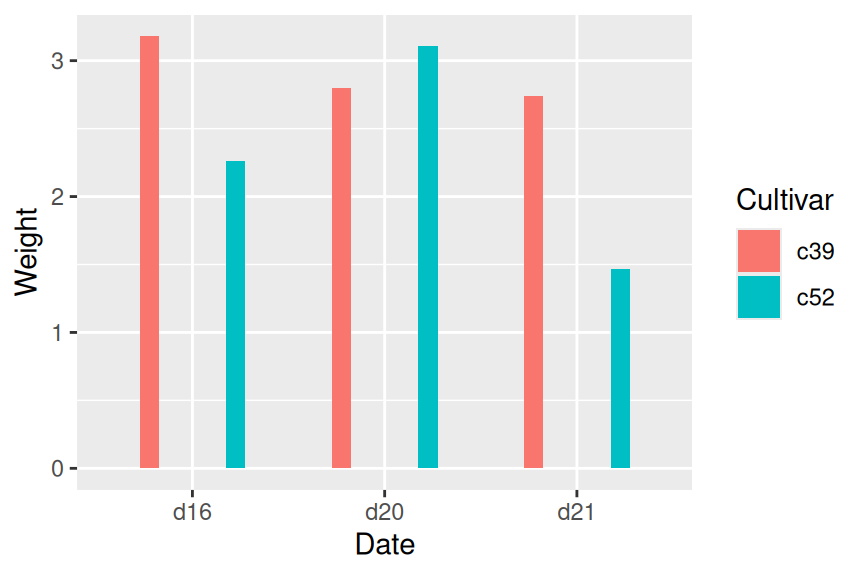
Figure 3.15: Same dodge width of 0.9, but different bar widths of 0.9 (left) and 0.2 (right)
If you make the entire graph wider or narrower, the bar dimensions will scale proportionally. To see how this works, you can just resize the window in which the graphs appear. For information about controlling this when writing to a file, see Chapter 14.