8.11 Removing Axis Labels
8.11.2 Solution
For the x-axis label, use xlab(NULL). For the y-axis label, use ylab(NULL).
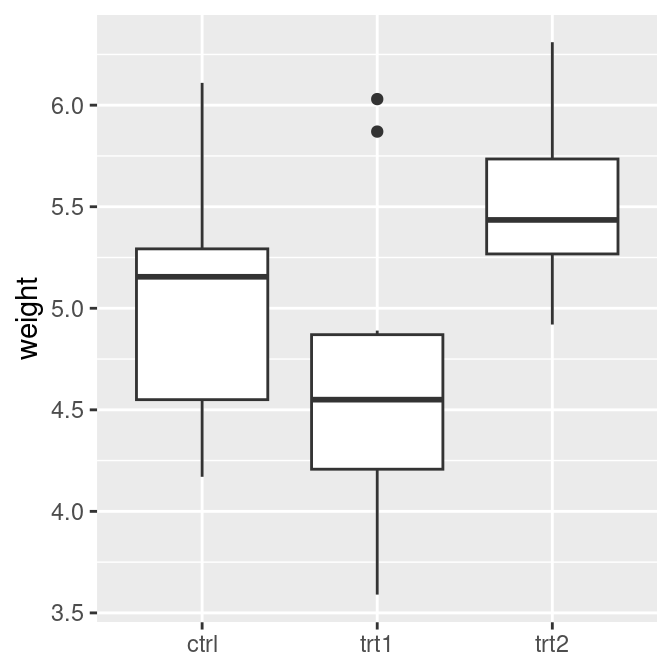
We’ll hide the x-axis in this example (Figure 8.21):
pg_plot <- ggplot(PlantGrowth, aes(x = group, y = weight)) +
  geom_boxplot()

pg_plot +
  xlab(NULL)
8.11.3 Discussion
Sometimes axis labels are redundant or obvious from the context, and don’t need to be displayed. In the example here, the x-axis represents group, but this should be obvious from the context. Similarly, if the y tick labels had kg or some other unit in each label, the axis label “weight” would be unnecessary.
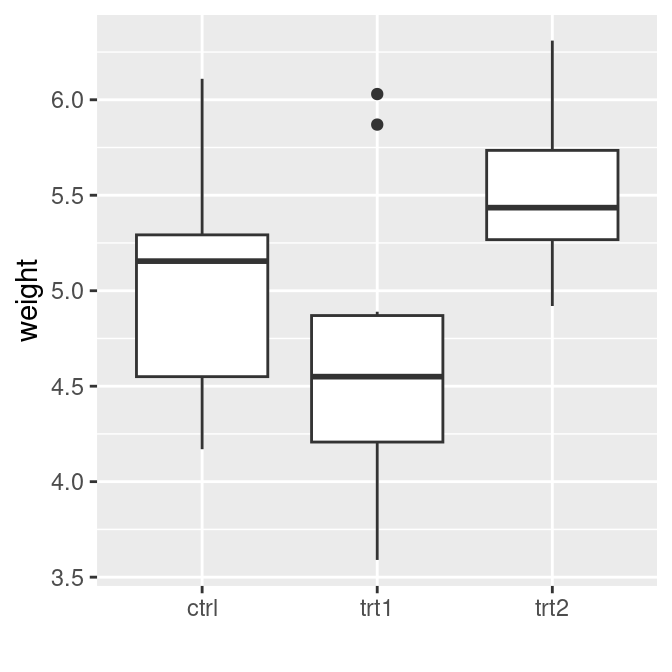
Another way to remove the axis label is to set it to an empty string. However, if you do it this way, the resulting graph will still have space reserved for the text, as shown in the graph on the right in Figure 8.21:
pg_plot +
  xlab("")

Figure 8.21: X-axis label with NULL (left); With the label set to "" (right)
When you use theme() to set axis.title.x = element_blank(), the name of the x or y scale is unchanged, but the text is not displayed and no space is reserved for it. When you set the label to "", the name of the scale is changed and the (empty) text does display.