12.6 Using a Manually Defined Palette for a Continuous Variable
12.6.2 Solution
In the example here, we’ll specify the colors for a continuous variable using various gradient scales (Figure 12.12). The colors can be named, or they can be specified with RGB values:
library(gcookbook)  # Load gcookbook for the heightweight data set

# Create the base plot
hw_plot <- ggplot(heightweight, aes(x = ageYear, y = heightIn, colour = weightLb)) +
  geom_point(size = 3)

hw_plot

# A gradient with a white midpoint
library(scales)
hw_plot +
  scale_colour_gradient2(
    low = muted("red"),
    mid = "white",
    high = muted("blue"),
    midpoint = 110
  )

# With a gradient between two colors (black and white)
hw_plot +
  scale_colour_gradient(low = "black", high = "white")

# A gradient of n colors
hw_plot +
  scale_colour_gradientn(colours = c("darkred", "orange", "yellow", "white"))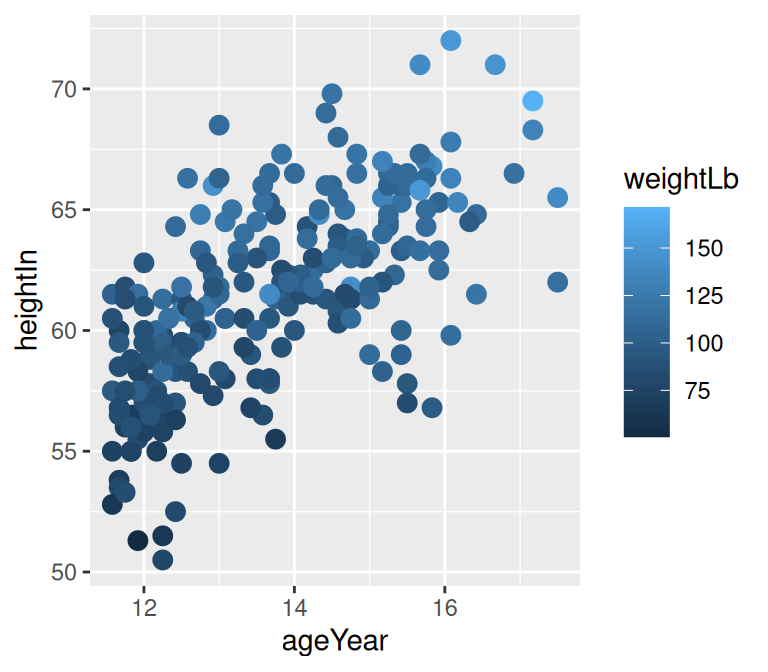
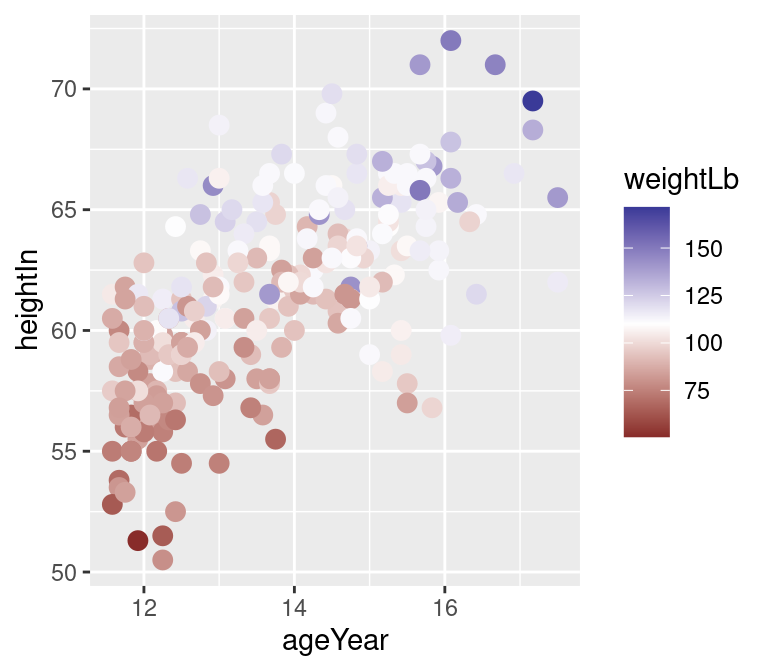
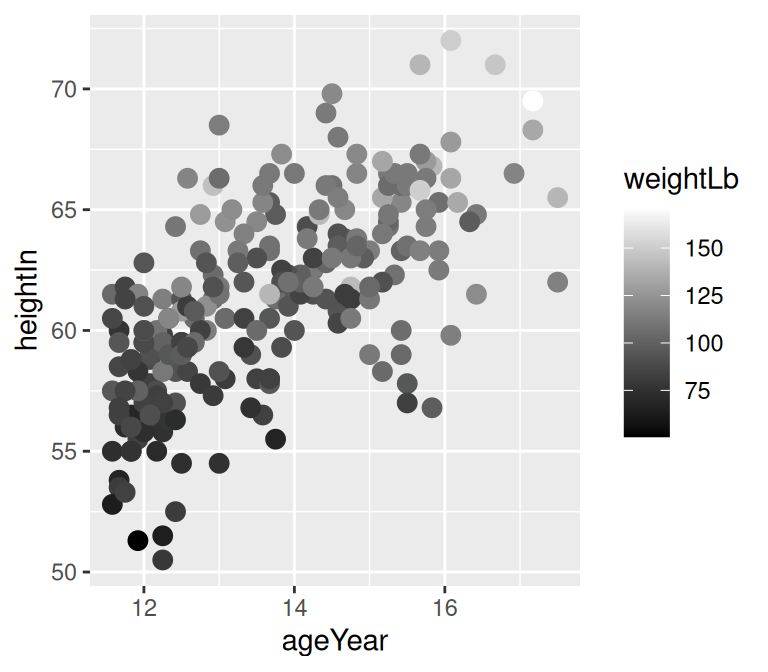
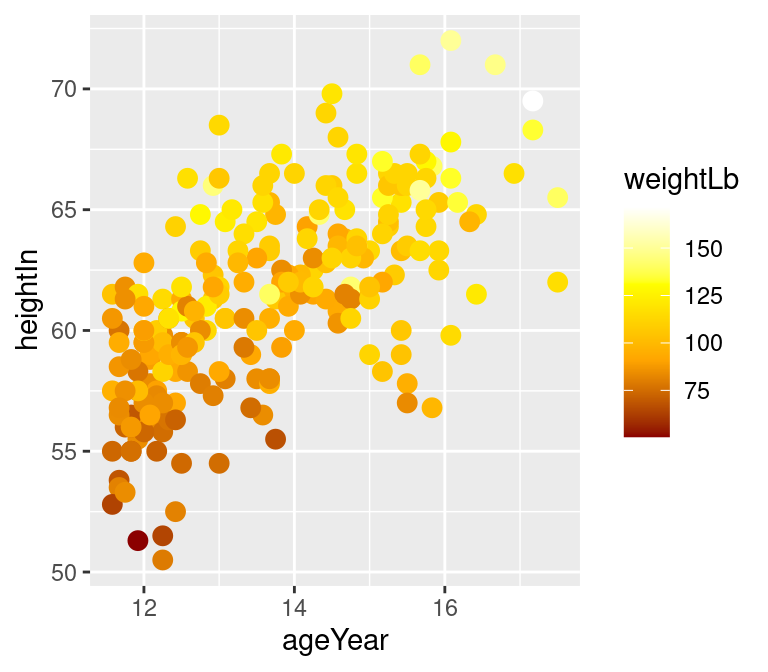
Figure 12.12: Clockwise from top left: default colors, two-color gradient (black and white) with scale_colour_gradient(), three-color gradient with midpoint with scale_colour_gradient2(), four-color gradient with scale_colour_gradientn()
For fill scales, use scale_fill_xxx() versions instead, where xxx is one of gradient, gradient2, or gradientn.
12.6.3 Discussion
Mapping continuous values to a color scale requires a continuously changing palette of colors. Table 12.2. lists the continuous color and fill scales.
| Fill scale | Color scale | Description |
|---|---|---|
scale_fill_gradient() |
scale_colour_gradient() |
Two-color gradient |
scale_fill_gradient2() |
scale_colour_gradient2() |
Gradient with a middle color and two colors that diverge from it |
scale_fill_gradientn() |
scale_colour_gradientn() |
Gradient with n colors, equally spaced |
scale_fill_viridis_c() |
scale_colour_viridis_c() |
Viridis palettes |
Notice that we used the muted() function in the examples. This is a function from the scales package that returns an RGB value that is a less-saturated version of the color chosen.
12.6.4 See Also
If you want use a discrete (categorical) scale instead of a continuous one, you can recode your data into categorical values. See Recipe 15.14.