8.7 Removing Tick Marks and Labels
8.7.2 Solution
To remove just the tick labels, as in Figure 8.14 (left), use theme(axis.text.y = element_blank()) (or do the same for axis.text.x). This will work for both continuous and categorical axes:
pg_plot <- ggplot(PlantGrowth, aes(x = group, y = weight)) +
  geom_boxplot()

pg_plot +
  theme(axis.text.y = element_blank())
To remove the tick marks, use theme(axis.ticks=element_blank()). This will remove the tick marks on both axes. (It’s not possible to hide the tick marks on just one axis.) In this example, we’ll hide all tick marks as well as the y tick labels (Figure 8.14, center):
To remove the tick marks, the labels, and the grid lines, set breaks to
NULL (Figure 8.14, right):
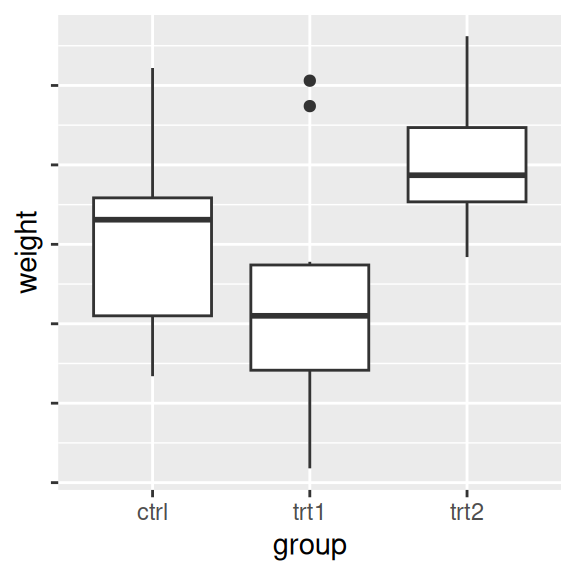
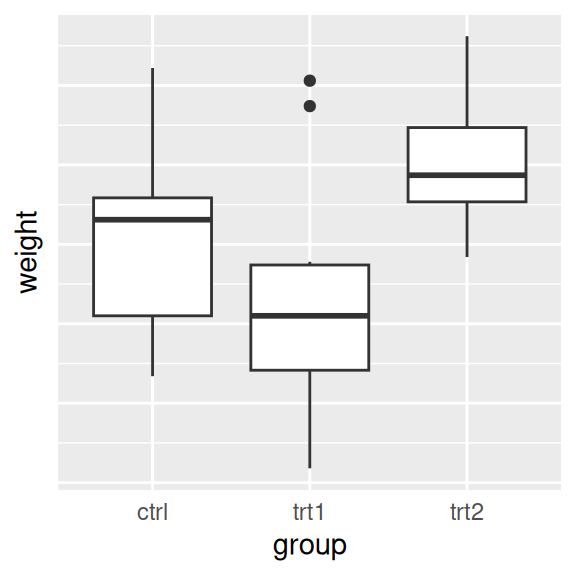

Figure 8.14: No tick labels on y-axis (left); No tick marks and no tick labels on y-axis (middle); With breaks=NULL (right)
This will work for continuous axes only; if you remove items from a categorical axis using limits, as in Recipe 8.4, the data with that value won’t be shown at all.
8.7.3 Discussion
There are actually three related items that can be controlled: tick labels, tick marks, and the grid lines. For continuous axes, ggplot() normally places a tick label, tick mark, and major grid line at each value of breaks. For categorical axes, these things go at each value of limits.
The tick labels on each axis can be controlled independently. However, the tick marks and grid lines must be controlled all together.