9.2 Changing the Appearance of Text
9.2.2 Solution
To set the appearance of theme items such as the title, axis labels, and axis tick marks, use theme() and set the item with element_text(). For example, axis.title.x controls the appearance of the x-axis label and plot.title controls the appearance of the title text (Figure 9.4):
library(gcookbook)  # Load gcookbook for the heightweight data set

# Base plot
hw_plot <- ggplot(heightweight, aes(x = ageYear, y = heightIn)) +
  geom_point()

# Controlling appearance of theme items
hw_plot +
  theme(axis.title.x = element_text(
    size = 16, lineheight = .9,
    family = "Times", face = "bold.italic", colour = "red"
  ))

hw_plot +
  ggtitle("Age and Height\nof Schoolchildren") +
  theme(plot.title = element_text(
    size = rel(1.5), lineheight = .9,
    family = "Times", face = "bold.italic", colour = "red"
  ))

# rel(1.5) means that the font will be 1.5 times the base font size of the theme.
# For theme elements, font size is in points.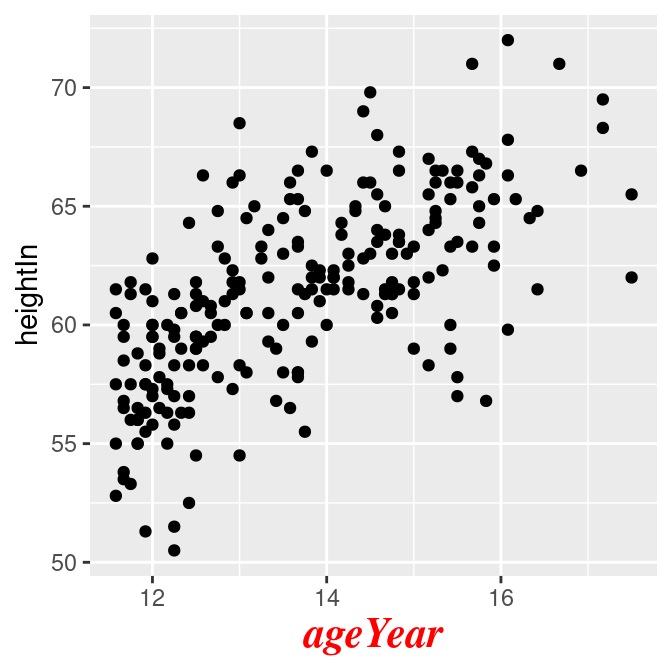
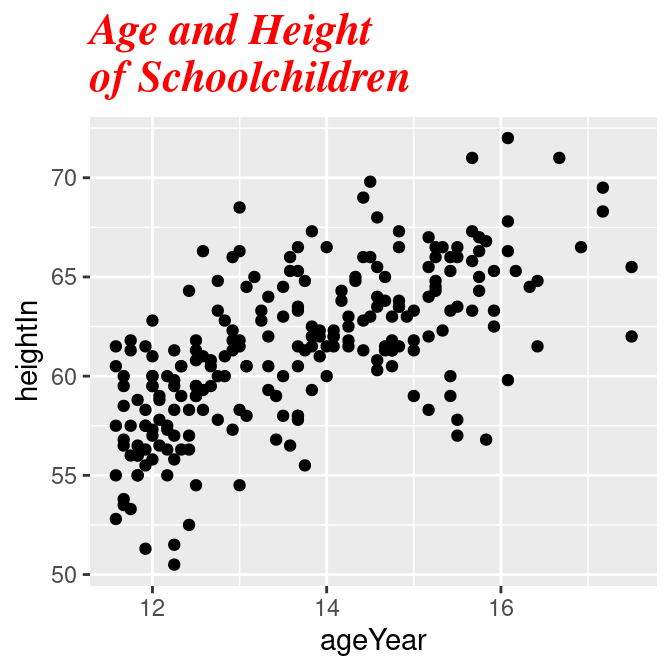
Figure 9.4: axis.title.x (left); plot.title (right)
To set the appearance of text geoms (text that’s in the plot itself, with geom_text() or annotate()), set the text properties. For example (Figure 9.5):
hw_plot +
  annotate("text", x = 15, y = 53, label = "Some text",
    size = 7, family = "Times", fontface = "bold.italic", colour = "red")

hw_plot +
  geom_text(aes(label = weightLb), size = 4, family = "Times", colour = "red")

# For text geoms, font size is in mm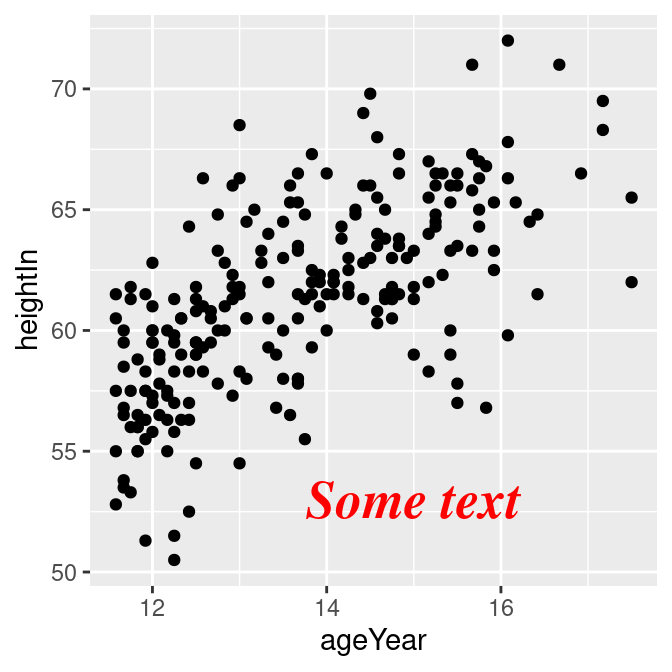
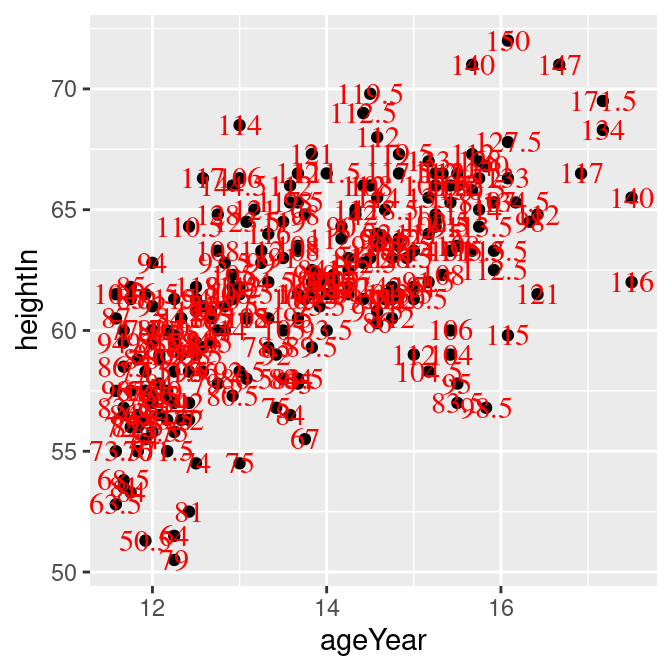
Figure 9.5: annotate("text") (left); geom_text() (right)
9.2.3 Discussion
There are two kinds of text items in ggplot2: theme elements and text geoms. Theme elements are all the non-data elements in the plot: the title, legends, and axes. Text geoms are things that are part of the plot itself, and reflect the data content.
There are differences in the parameters, as shown in Table 9.1.
The theme elements are listed in Table 9.2. Most of them are straightforward. Some are shown in Figure 9.6.
| Element name | Description |
|---|---|
axis.title |
Appearance of axis labels on both axes |
axis.title.x |
Appearance of x-axis label |
axis.title.y |
Appearance of y-axis label |
axis.ticks |
Appearance of tick labels on both axes |
axis.ticks.x |
Appearance of x tick labels |
axis.ticks.y |
Appearance of y tick labels |
legend.title |
Appearance of legend title |
legend.text |
Appearance of legend items |
plot.title |
Appearance of overall plot title |
strip.text |
Appearance of facet labels in both directions |
strip.text.x |
Appearance of horizontal facet labels |
strip.text.y |
Appearance of vertical facet labels |
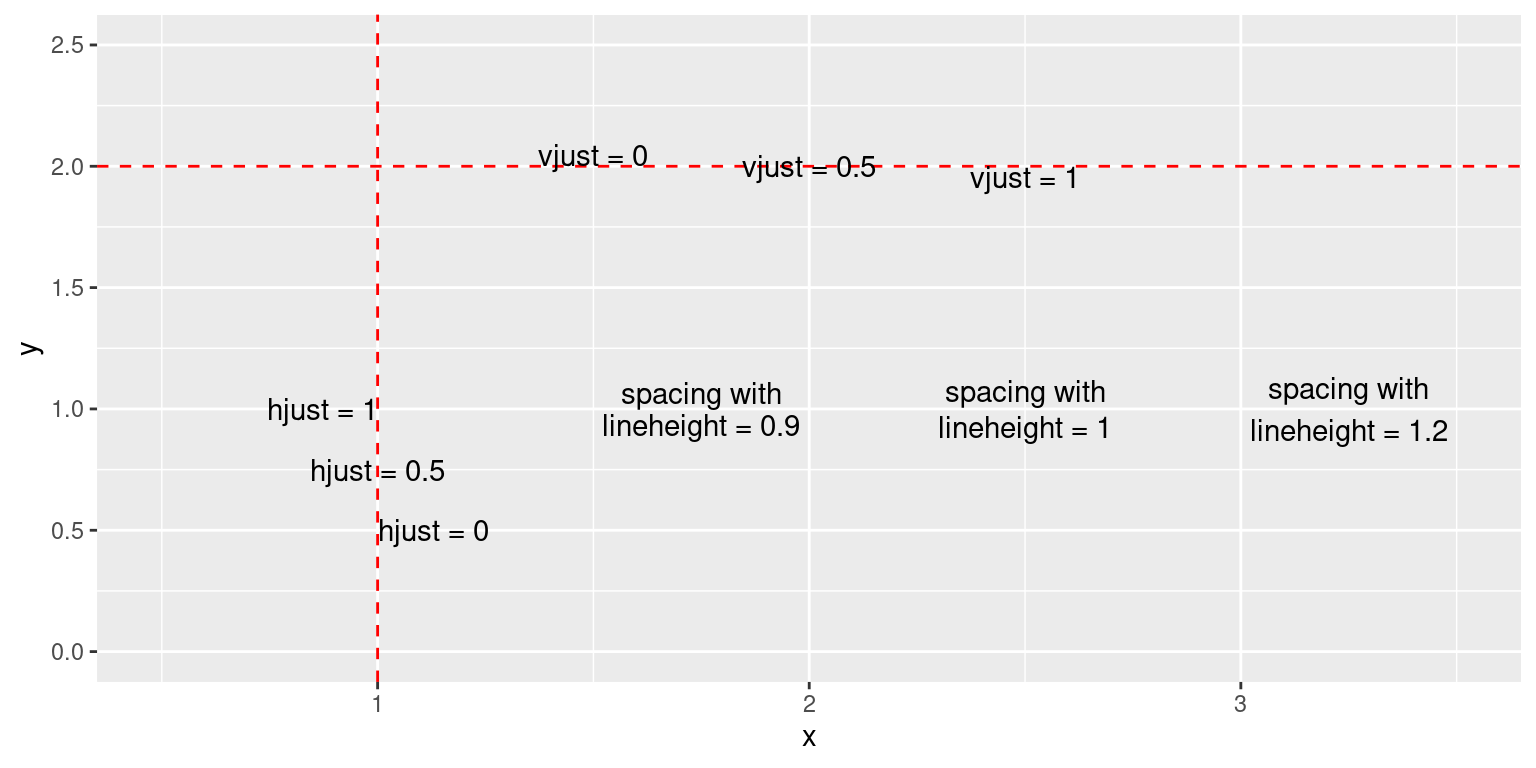
Figure 9.6: Aligning with hjust and vjust, and spacing with lineheight