8.12 Changing the Appearance of Axis Labels
8.12.2 Solution
To change the appearance of the x-axis label (Figure 8.22), use axis.title.x:
library(gcookbook)  # Load gcookbook for the heightweight data set

hw_plot <- ggplot(heightweight, aes(x = ageYear, y = heightIn)) +
  geom_point()

hw_plot +
  theme(axis.title.x = element_text(face = "italic", colour = "darkred", size = 14))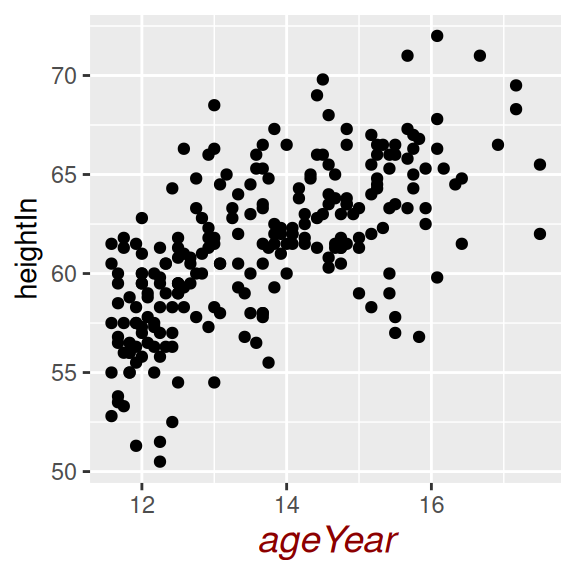
Figure 8.22: X-axis label with customized appearance
8.12.3 Discussion
For the y-axis label, it might also be useful to display the text unrotated, as shown in Figure 8.23 (left). The \n in the label represents a newline character:
hw_plot +
  ylab("Height\n(inches)") +
  theme(axis.title.y = element_text(angle = 0, face = "italic", size = 14))
When you call element_text(), the default angle is 0, so if you set axis.title.y but don’t specify the angle, it will show in this orientation, with the top of the text pointing up. If you change any other properties of axis.title.y and want it to be displayed in its usual orientation, rotated 90 degrees, you must manually specify the angle (Figure 8.23, right):
hw_plot +
  ylab("Height\n(inches)") +
  theme(axis.title.y = element_text(
    angle = 90,
    face = "italic",
    colour = "darkred",
    size = 14)
  )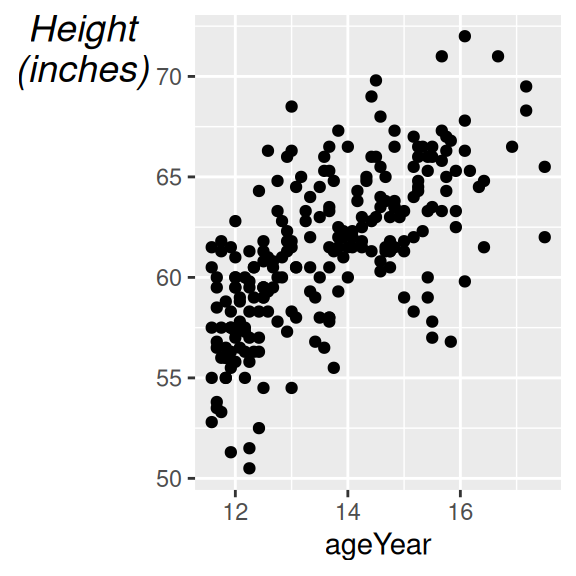
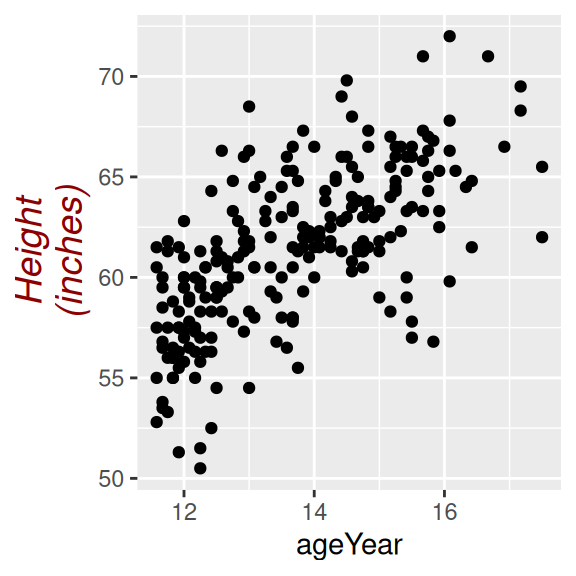
Figure 8.23: Y-axis label with angle = 0 (left); With angle = 90 (right)
8.12.4 See Also
See Recipe 9.2 for more about controlling the appearance of the text.