9.1 Setting the Title of a Graph
9.1.2 Solution
Use ggtitle() to add a title, as shown in Figure 9.1:
library(gcookbook)  # Load gcookbook for the heightweight data set

hw_plot <- ggplot(heightweight, aes(x = ageYear, y = heightIn)) +
  geom_point()

hw_plot +
  ggtitle("Age and Height of Schoolchildren")

# Use \n for a newline
hw_plot +
  ggtitle("Age and Height\nof Schoolchildren")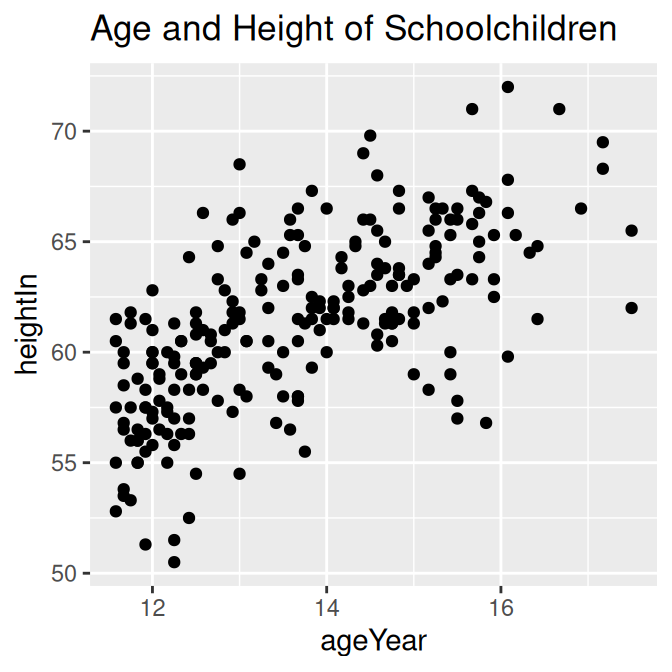
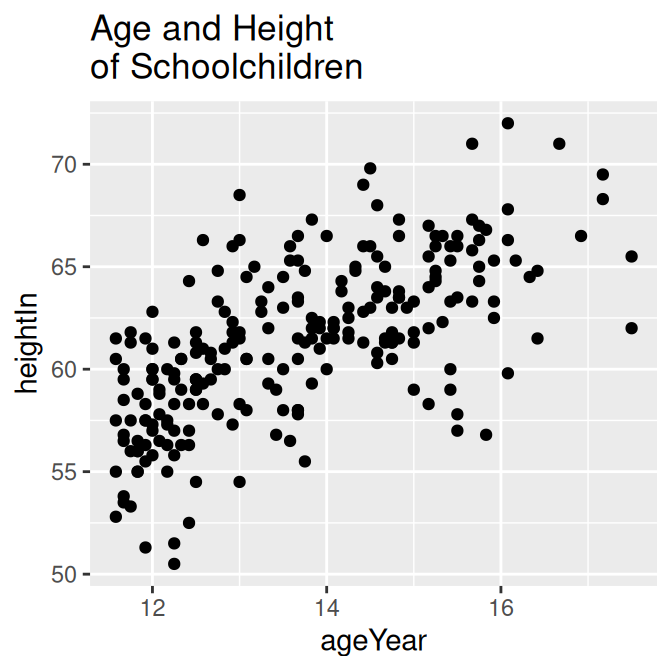
Figure 9.1: Scatter plot with a title added (left); With a \n for a newline (right)
9.1.3 Discussion
ggtitle() is equivalent to using labs(title = "Title text").
You can add a subtitle by providing a string as the second argument of ggtitle(). By default it will display with slightly smaller text than the main title.
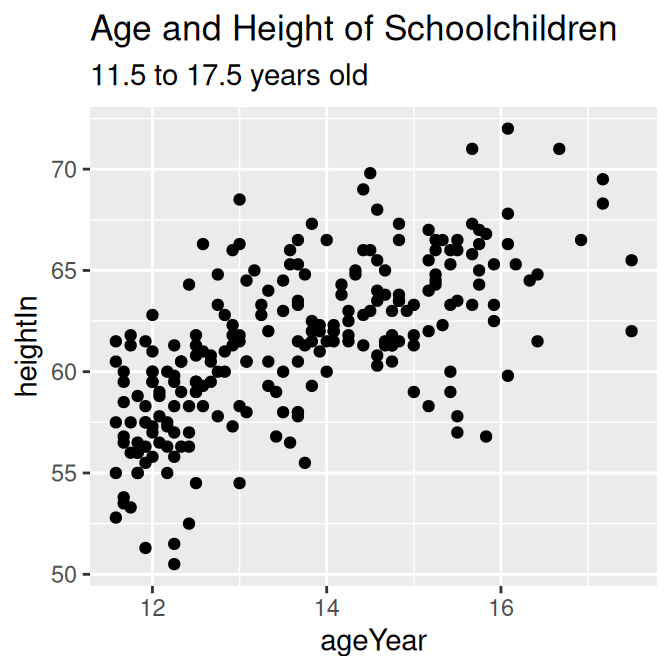
Figure 9.2: Scatter plot with a subtitle
If you want to move the title inside the plotting area, you can use one of two methods, both of which are a little bit of a hack (Figure 9.3). The first method is to use ggtitle() with a negative vjust value. The drawback of this method is that it still reserves blank space above the plotting region for the title.
The second method is to instead use a text annotation, setting its x position to the middle of the x range and its y position to Inf, which places it at the top of the plotting region. This also requires a positive vjust value to bring the text fully inside the plotting region:
# Move the title inside
hw_plot +
  ggtitle("Age and Height of Schoolchildren") +
  theme(plot.title = element_text(vjust = -8))

# Use a text annotation instead
hw_plot +
  annotate("text", x = mean(range(heightweight$ageYear)), y = Inf,
           label = "Age and Height of Schoolchildren", vjust = 1.5, size = 4.5)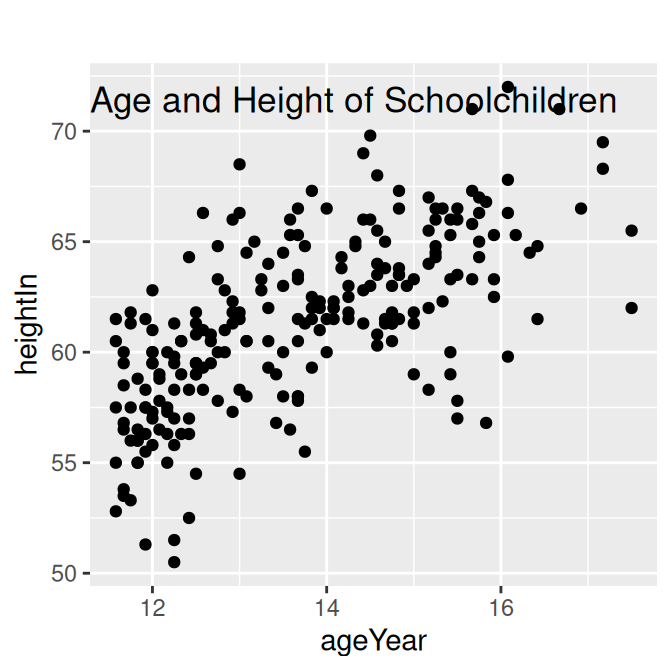
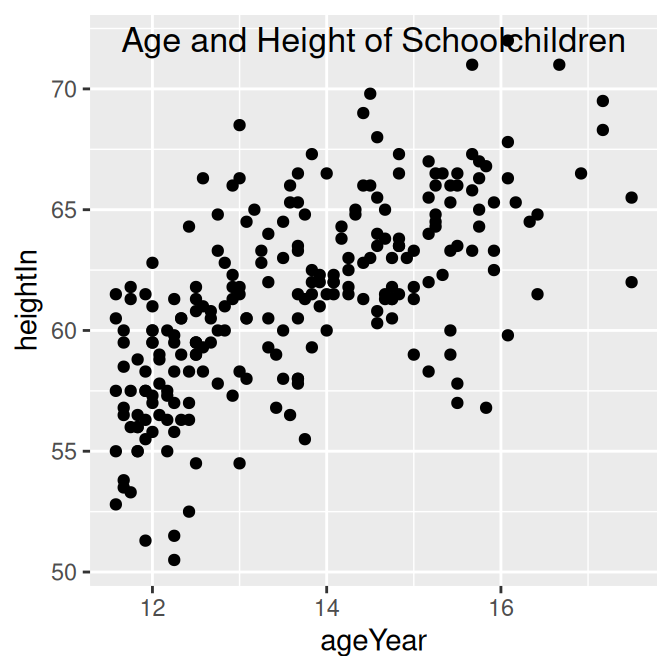
Figure 9.3: Title with ggtitle and a negative vjust value (note the extra space above the plotting area) (left); With a text annotation at the top of the figure (right)