7.4 Adding Line Segments and Arrows
7.4.2 Solution
Use annotate("segment"). In this example, we’ll use the climate data set and use a subset of data from the Berkeley source (Figure 7.10):
library(gcookbook) # Load gcookbook for the climate data set

p <- ggplot(filter(climate, Source == "Berkeley"), aes(x = Year, y = Anomaly10y)) +
  geom_line()

p +
  annotate("segment", x = 1950, xend = 1980, y = -.25, yend = -.25)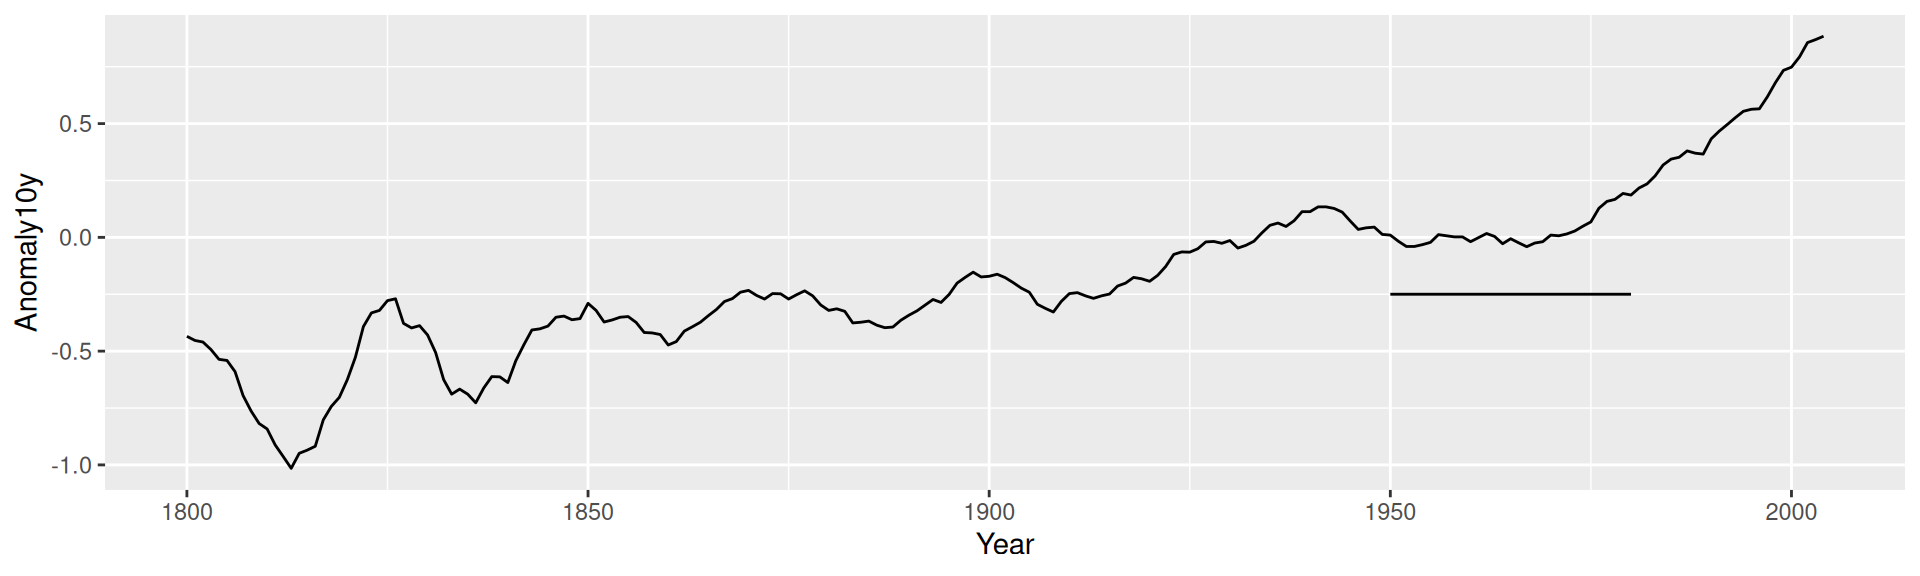
Figure 7.10: Line segment annotation
7.4.3 Discussion
It’s possible to add arrowheads or flat ends to the line segments, using arrow() from the grid package. In this example, we’ll do both (Figure 7.11):
library(grid)
p +
  annotate("segment", x = 1850, xend = 1820, y = -.8, yend = -.95,
           colour = "blue", size = 2, arrow = arrow()) +
  annotate("segment", x = 1950, xend = 1980, y = -.25, yend = -.25,
           arrow = arrow(ends = "both", angle = 90, length = unit(.2,"cm")))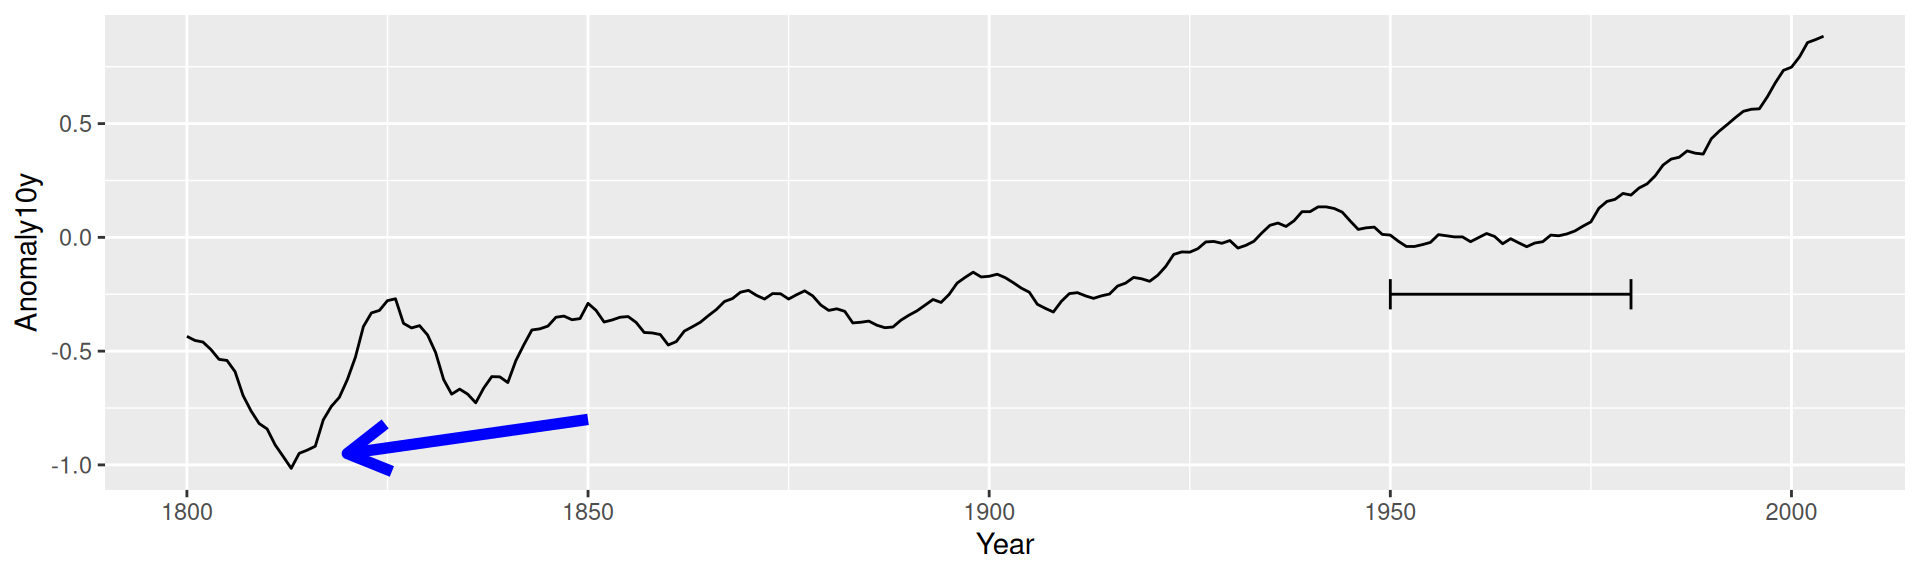
Figure 7.11: Line segments with arrow heads
The default angle is 30, and the default length of the arrowhead lines is 0.2 inches.
If one or both axes are discrete, the x and y positions are such that the categorical items have coordinate values 1, 2, 3, and so on.