9.3 Using Themes
9.3.2 Solution
There are many premade themes that are already included in ggplot2. The default ggplot2 theme is theme_grey(), but the examples below also showcase theme_bw(), theme_minimal(), and theme_classic().
To use a premade theme, add theme_bw() or another theme to your plot (Figure 9.7):
library(gcookbook)  # Load gcookbook for the heightweight data set

# Create the base plot
hw_plot <- ggplot(heightweight, aes(x = ageYear, y = heightIn)) +
  geom_point()

# Grey theme (the default)
hw_plot +
  theme_grey()

# Black-and-white theme
hw_plot +
  theme_bw()

# Minimal theme without background annotations
hw_plot +
  theme_minimal()

# Classic theme, with axis lines but no gridlines
hw_plot +
  theme_classic()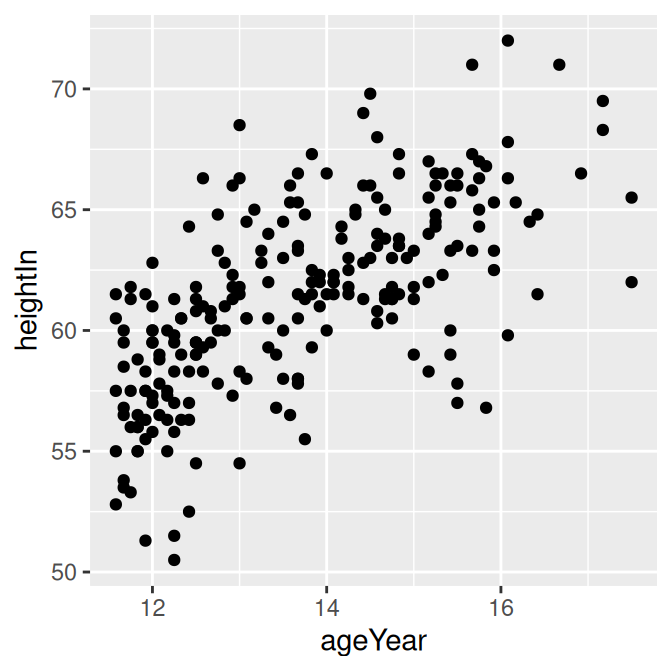
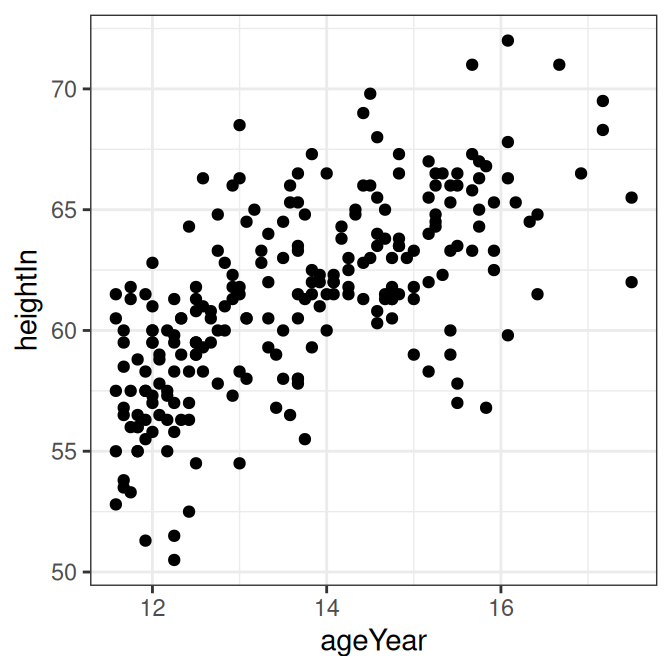
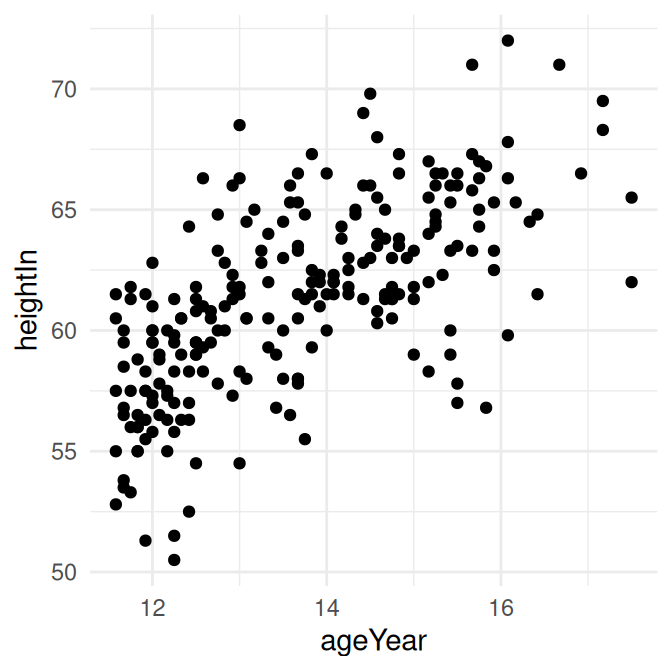
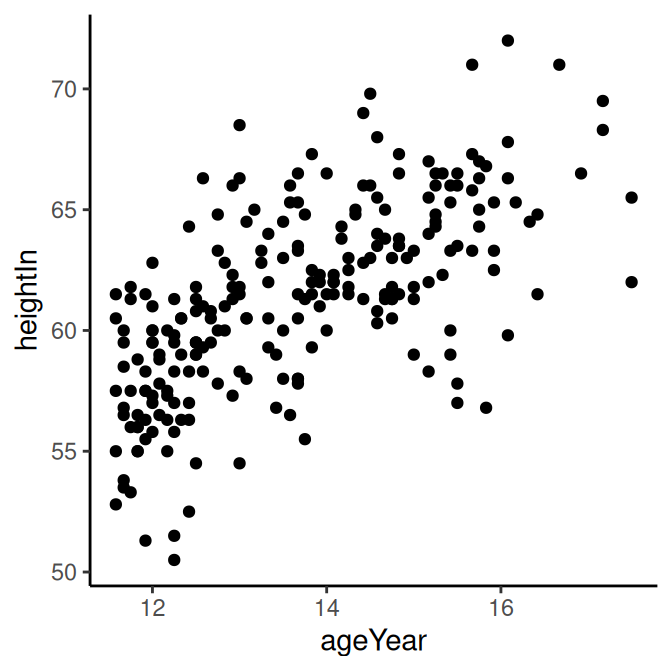
Figure 9.7: Scatter plot with theme_grey() (the default, top left); with theme_bw() (top right); with theme_minimal() (bottom left); with theme_classic() (bottom right)
Another theme included in ggplot2 is theme_void(), which makes all plot elements blank and only shows your data (Figure 9.8. This is especially useful if you don’t want any default theme settings, and instead want a blank slate on which to choose your own theme elements.
Figure 9.8: Scatter plot with theme_void()
9.3.3 Discussion
Some commonly used properties of theme elements in ggplot2 are those things that are controlled by theme(). Most of these things, like the title, legend, and axes, are outside the plot area, but some of them are inside the plot area, such as grid lines and the background coloring.
Besides the themes included in ggplot2, it is also possible to create your own.
You can set the base font family and size with either of the included themes (the default base font family is Helvetica, and the default size is 12):
You can set the default theme for the current R session with theme_set(), although it’s generally not a good idea to set options globally because it may affect other plots that are unrelated to your current project:
9.3.4 See Also
To see additional complete themes included in ggplot2, see https://ggplot2.tidyverse.org/reference/ggtheme.html.
To modify a theme, see Recipe 9.4.
To create your own themes, see Recipe 9.5.
See ?theme to see all the available theme properties.