7.2 Using Mathematical Expressions in Annotations
7.2.2 Solution
Use annotate(geom = "text") with parse = TRUE (Figure 7.5):
# A normal curve
p <- ggplot(data.frame(x = c(-3,3)), aes(x = x)) +
  stat_function(fun = dnorm)

p +
  annotate("text", x = 2, y = 0.3, parse = TRUE,
           label = "frac(1, sqrt(2 * pi)) * e ^ {-x^2 / 2}")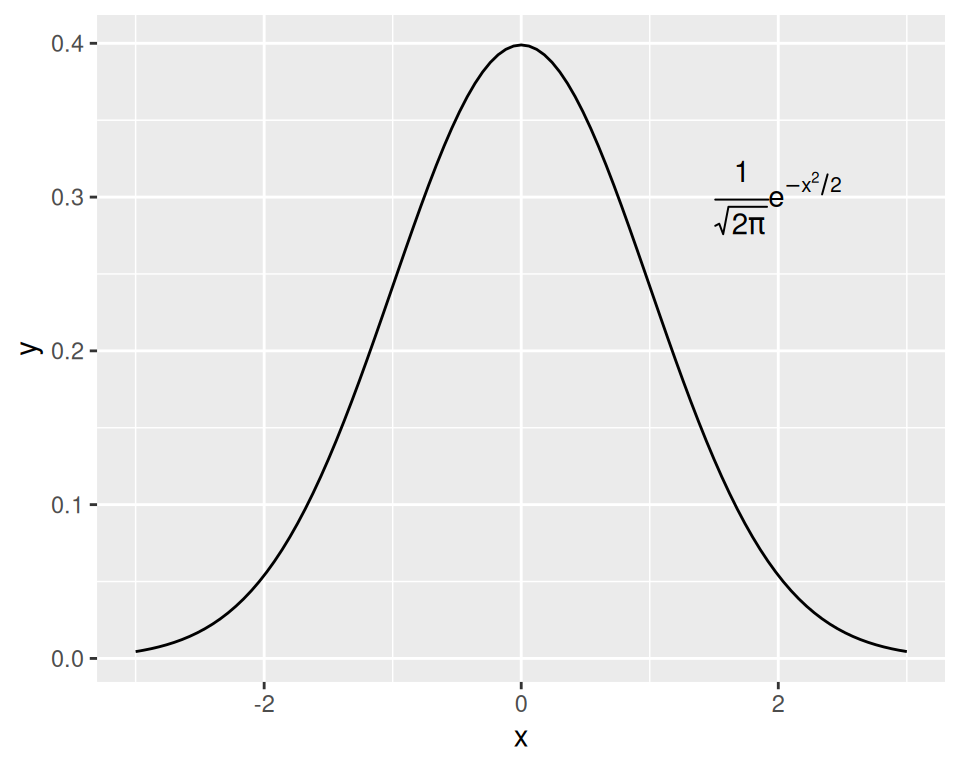
Figure 7.5: Annotation with mathematical expressions
7.2.3 Discussion
Mathematical expressions made with text geoms using parse = TRUE in ggplot2 have a format similar to those made with plotmath and expression in base R, except that they are stored as strings, rather than as expression objects.
To mix regular text with expressions, use single quotes within double quotes (or vice versa) to mark the plain-text parts. Each block of text enclosed by the inner quotes is treated as a variable in a mathematical expression. Bear in mind that, in R’s syntax for mathematical expressions, you can’t simply put a variable right next to another without something else in between. To display two variables next to each other, as in Figure 7.6, put a * operator between them; when displayed in a graphic, this is treated as an invisible multiplication sign (for a visible multiplication sign, use %*%):
p +
  annotate("text", x = 0, y = 0.05, parse = TRUE, size = 4,
           label = "'Function:  ' * y==frac(1, sqrt(2*pi)) * e^{-x^2/2}")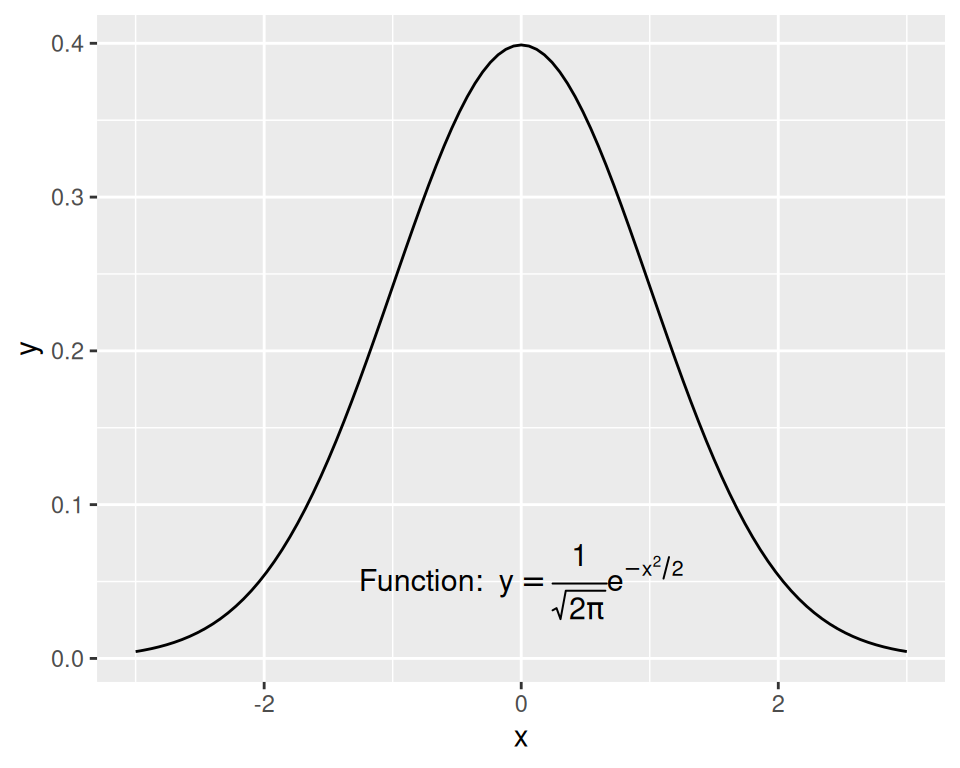
Figure 7.6: Mathematical expression with regular text