9.4 Changing the Appearance of Theme Elements
9.4.2 Solution
To modify a theme, add theme() with a corresponding element_xx object. These include element_line, element_rect, and element_text. The following code shows how to modify many of the commonly used theme properties (Figure 9.9):
library(gcookbook)  # Load gcookbook for the heightweight data set

# Create the base plot
hw_plot <- ggplot(heightweight, aes(x = ageYear, y = heightIn, colour = sex)) +
  geom_point()

# Options for the plotting area
hw_plot +
  theme(
    panel.grid.major = element_line(colour = "red"),
    panel.grid.minor = element_line(colour = "red", linetype = "dashed", size = 0.2),
    panel.background = element_rect(fill = "lightblue"),
    panel.border = element_rect(colour = "blue", fill = NA, size = 2)
  )
#> Warning: The `size` argument of `element_rect()` is deprecated as of ggplot2 3.4.0.
#> ℹ Please use the `linewidth` argument instead.
#> This warning is displayed once per session.
#> Call `lifecycle::last_lifecycle_warnings()` to see where this warning was
#> generated.

# Options for the legend
hw_plot +
  theme(
    legend.background = element_rect(fill = "grey85", colour = "red", size = 1),
    legend.title = element_text(colour = "blue", face = "bold", size = 14),
    legend.text = element_text(colour = "red"),
    legend.key = element_rect(colour = "blue", size = 0.25)
  )

# Options for text items
hw_plot +
  ggtitle("Plot title here") +
  theme(
    axis.title.x = element_text(colour = "red", size = 14),
    axis.text.x  = element_text(colour = "blue"),
    axis.title.y = element_text(colour = "red", size = 14, angle = 90),
    axis.text.y  = element_text(colour = "blue"),
    plot.title = element_text(colour = "red", size = 20, face = "bold")
  )

# Options for facets
hw_plot +
  facet_grid(sex ~ .) +
  theme(
    strip.background = element_rect(fill = "pink"),
    strip.text.y = element_text(size = 14, angle = -90, face = "bold")
  )  # strip.text.x is the same, but for horizontal facets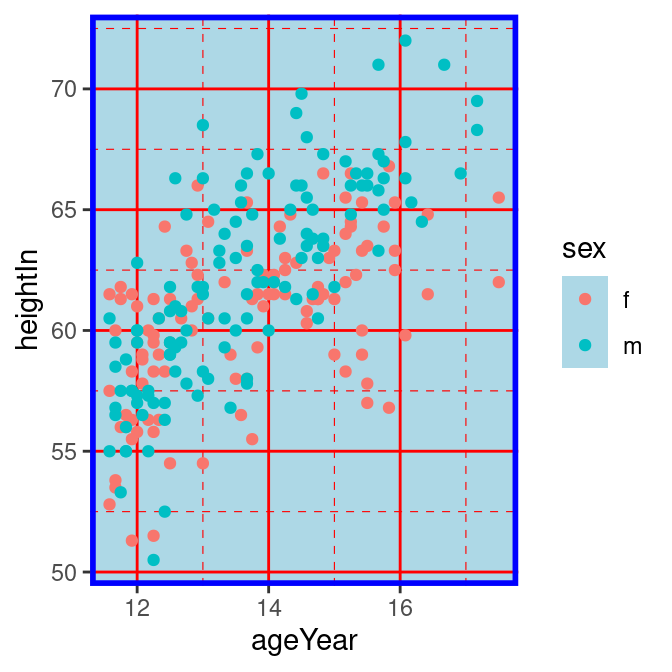
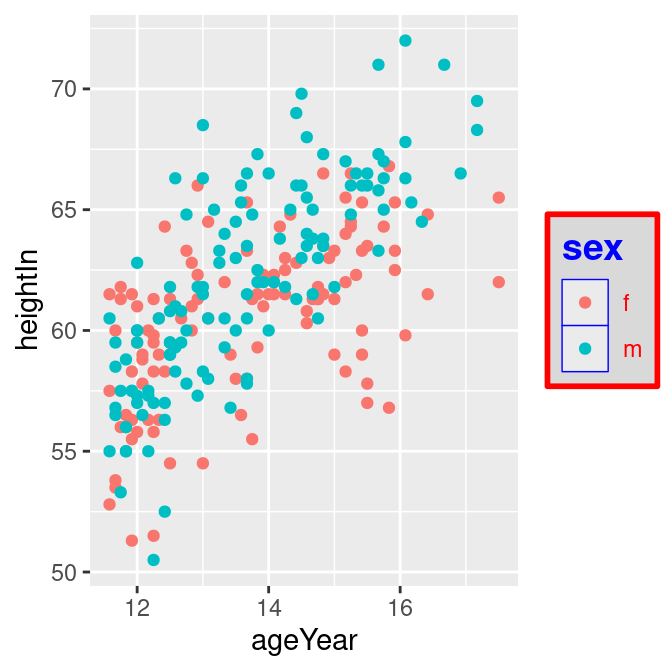
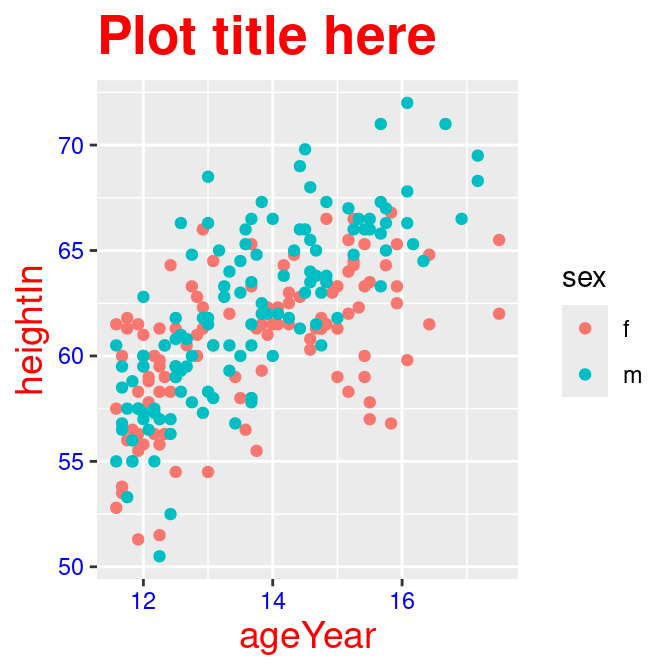
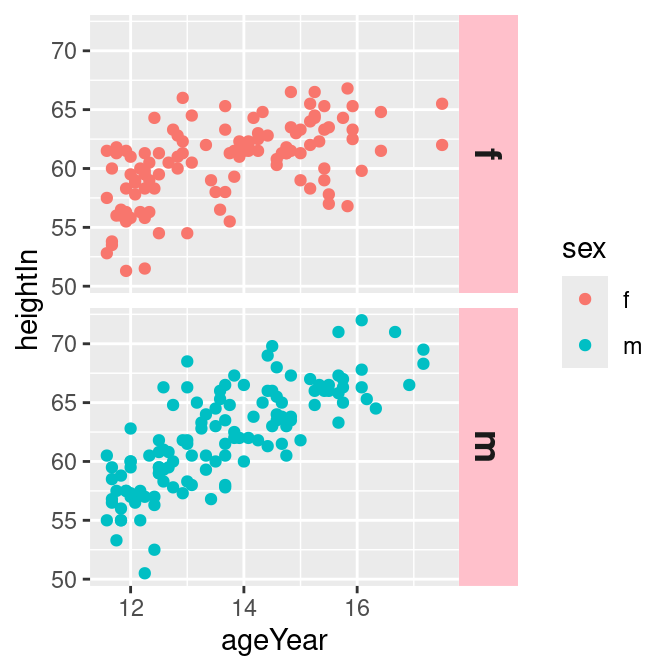
Figure 9.9: Clockwise from top left: modifying theme properties for the plotting area, the legend, the facets, and the text items
9.4.3 Discussion
If you want to use a saved theme and tweak a few parts of it with theme(), the theme() must come after the theme specification. Otherwise, anything set by theme() will be unset by the theme you add:
# theme() has no effect if before adding a complete theme
hw_plot +
  theme(axis.title.x = element_text(colour = "red")) +
  theme_bw()

# theme() works if after a complete theme
hw_plot +
  theme_bw() +
  theme(axis.title.x = element_text(colour = "red", size = 12))
Many of the commonly used theme properties are shown in Table 9.3.
Name
|
DescriptionAll text elements |
Element type
|
|
rect |
All rectangular elements | element_rect() |
|
line |
All line elements | element_line() |
|
axis.line |
Lines along axes | element_line() |
|
axis.title |
Appearance of both axis labels | element_text() |
|
axis.title.x |
X-axis label appearance | element_text() |
|
axis.title.y |
Y-axis label appearance | element_text() |
|
axis.text |
Appearance of tick labels on both axes | element_text() |
|
axis.text.x |
X-axis tick label appearance | element_text() |
|
axis.text.y |
Y-axis tick label appearance | element_text() |
|
legend.background |
Background of legend | element_rect() |
|
legend.text |
Legend item appearance | element_text() |
|
legend.title |
Legend title appearance | element_text() |
|
legend.position |
Position of the legend | "left", "right", |
"bottom", "top", or |
two-element numeric |
vector if you wish to |
place it inside the |
plot area (for more |
on legend placement, |
see Recipe |
10.2) | |
|
panel.background |
Background of plotting area | element_rect() |
|
panel.border |
Border around plotting area | element_rect(linetype="dashed") |
| |
|
panel.grid.major |
Major grid lines | element_line() |
|
panel.grid.major.x |
Major grid lines, vertical | element_line() |
|
panel.grid.major.y |
Major grid lines, horizontal | element_line() |
|
panel.grid.minor |
Minor grid lines | element_line() |
|
panel.grid.minor.x |
Minor grid lines, vertical | element_line() |
|
panel.grid.minor.y |
Minor grid lines, horizontal | element_line() |
|
plot.background |
Background of the entire plot | element_rect(fill = "white", colour = NA)
| |
|
plot.title |
Title text appearance | element_text() |
|
strip.background |
Background of facet labels | element_rect() |
|
strip.text |
Text appearance for vertical and horizontal facet labels | element_text() |
|
strip.text.x |
Text appearance for horizontal facet labels | element_text() |
|
strip.text.y |
Text appearance for vertical facet labels | element_text() |
|