4.5 Changing the Appearance of Points
4.5.2 Solution
In geom_point(), set the size, shape, colour, and/or fill outside of aes() (the result is shown in Figure 4.14):
ggplot(BOD, aes(x = Time, y = demand)) +
  geom_line() +
  geom_point(size = 4, shape = 22, colour = "darkred", fill = "pink")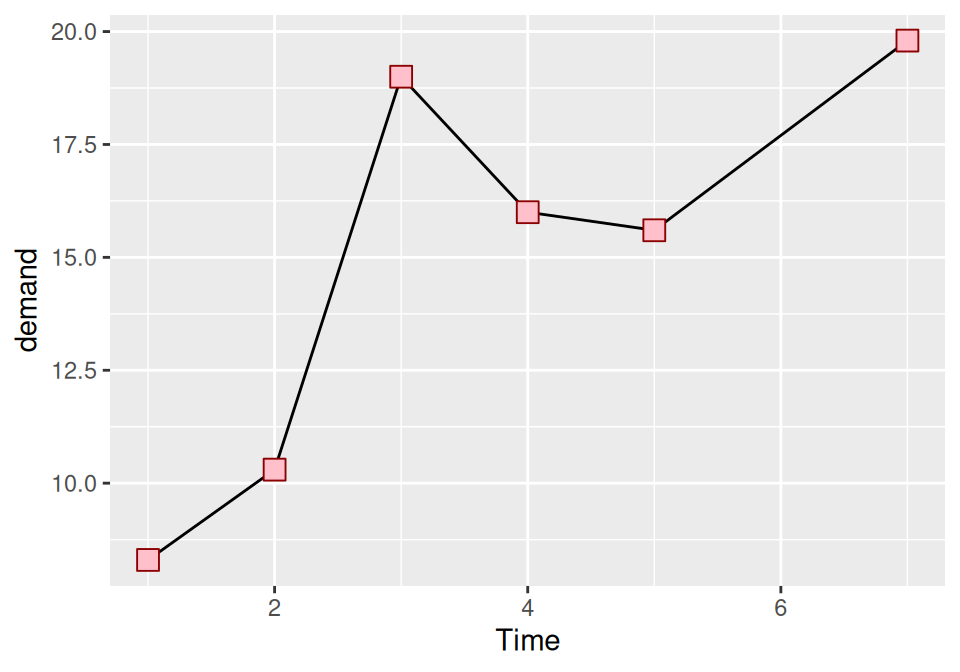
Figure 4.14: Points with custom size, shape, color, and fill
4.5.3 Discussion
The default shape for points is a solid circle, the default size is 2, and the default colour is black. The fill color is relevant only for some point shapes (numbered 21–25), which have separate outline and fill colors (see Recipe 5.3 for a chart of shapes). The fill color is typically NA, or empty; you can fill it with white to get hollow-looking circles, as shown in Figure 4.15:
ggplot(BOD, aes(x = Time, y = demand)) +
  geom_line() +
  geom_point(size = 4, shape = 21, fill = "white")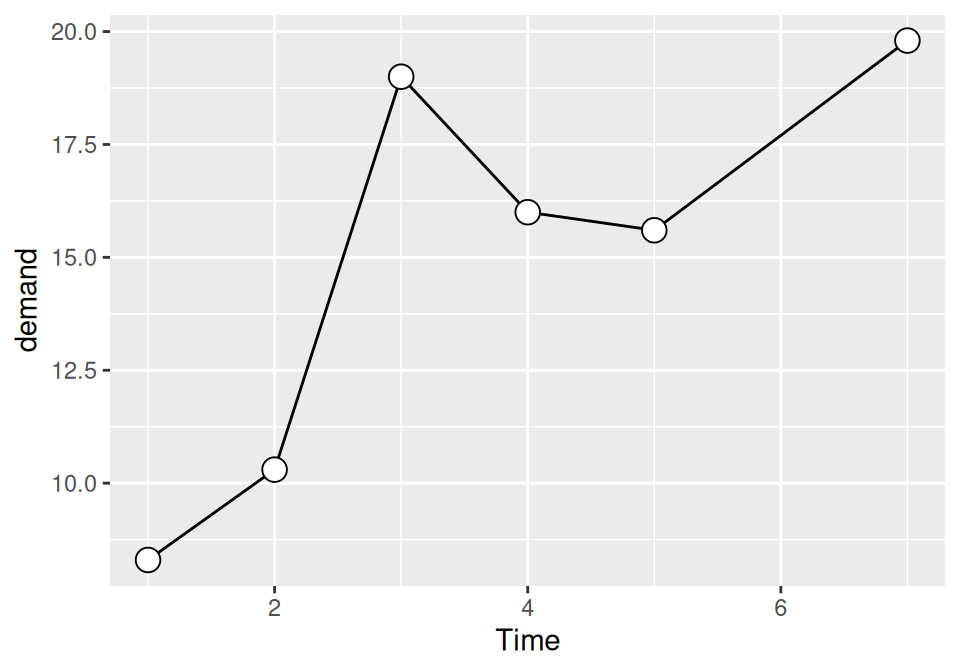
Figure 4.15: Points with a white fill
If the points and lines have different colors, you should specify the points after the lines, so that they are drawn on top. Otherwise, the lines will be drawn on top of the points.
For multiple lines, we saw in Recipe 4.3 how to draw differently colored points for each group by mapping variables to aesthetic properties of points, inside of aes(). The default colors are not very appealing, so you may want to use a different palette, using scale_colour_brewer() or scale_colour_manual(). To set a single constant shape or size for all the points, as in Figure 4.16, specify shape or size outside of aes():
library(gcookbook)  # Load gcookbook for the tg data set

# Save the position_dodge specification because we'll use it multiple times
pd <- position_dodge(0.2)

ggplot(tg, aes(x = dose, y = length, fill = supp)) +
  geom_line(position = pd) +
  geom_point(shape = 21, size = 3, position = pd) +
  scale_fill_manual(values = c("black","white"))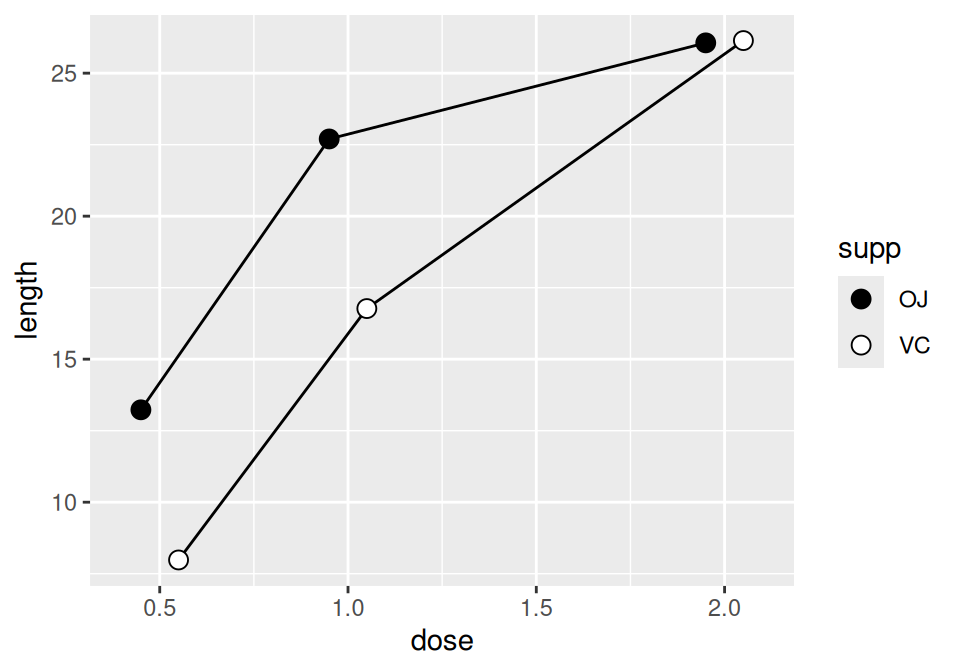
Figure 4.16: Line graph with manually specified fills of black and white, and a slight dodge