13.20 Creating a Map from a Shapefile
13.20.2 Solution
Load the shapefile using st_read() from the sf package, then plot it with geom_sf() (Figure 13.39):
library(sf)

# Load the shapefile
taiwan_shp <- st_read("fig/TWN_adm/TWN_adm2.shp")
#> Reading layer `TWN_adm2' from data source
#>   `/home/runner/work/rgcookbook/rgcookbook/fig/TWN_adm/TWN_adm2.shp'
#>   using driver `ESRI Shapefile'
#> Simple feature collection with 22 features and 11 fields
#> Geometry type: MULTIPOLYGON
#> Dimension:     XY
#> Bounding box:  xmin: 116.71 ymin: 20.6975 xmax: 122.1085 ymax: 25.63431
#> Geodetic CRS:  WGS 84

ggplot(taiwan_shp) +
  geom_sf()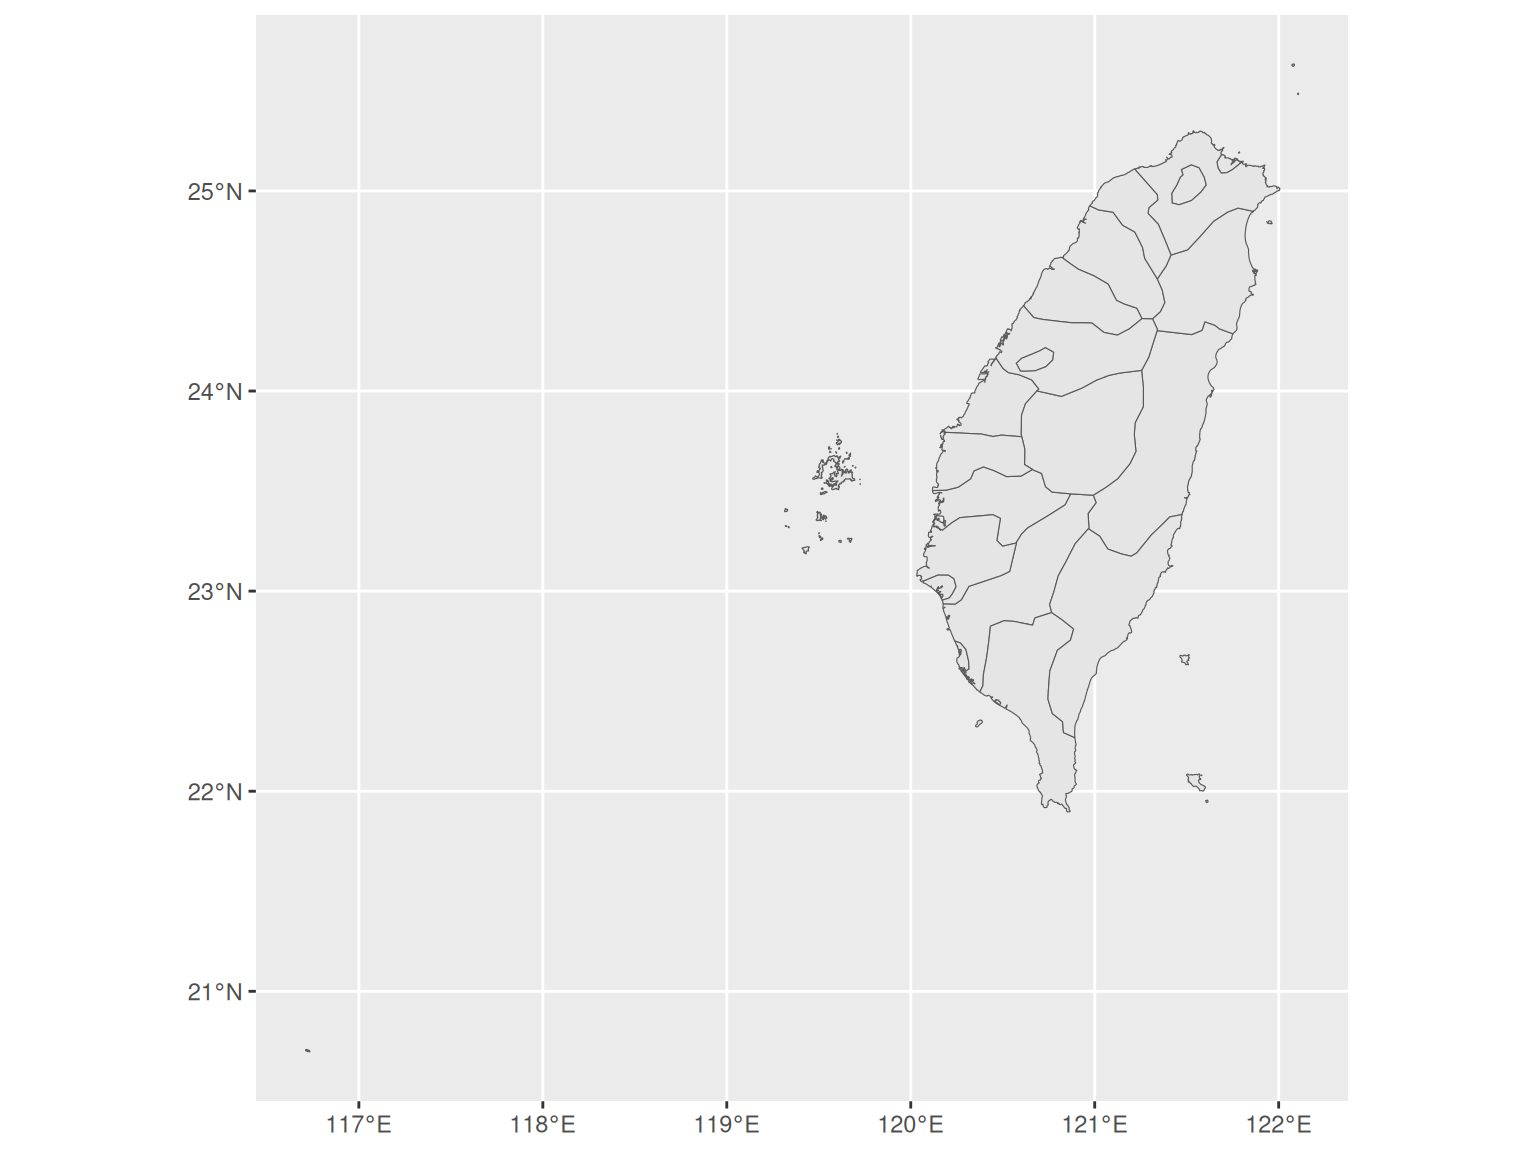
Figure 13.39: A map created from a shapefile
13.20.3 Discussion
Esri shapefiles are a common format for map data. The st_read() function reads a shape file and returns a sf object, which will also have other useful columns. Here’s a look at the contents of the object.
taiwan_shp
#> Simple feature collection with 22 features and 11 fields
#> Geometry type: MULTIPOLYGON
#> Dimension:     XY
#> Bounding box:  xmin: 116.71 ymin: 20.6975 xmax: 122.1085 ymax: 25.63431
#> Geodetic CRS:  WGS 84
#> First 6 features:
#>   ID_0 ISO NAME_0 ID_1         NAME_1 ID_2         NAME_2 NL_NAME_2
#> 1  223 TWN Taiwan    1      Kaohsiung    1 Kaohsiung City      <NA>
#> 2  223 TWN Taiwan    2 Pratas Islands    2           <NA>      <NA>
#> 3  223 TWN Taiwan    3         Taipei    3    Taipei City      <NA>
#> 4  223 TWN Taiwan    4         Taiwan    4       Changhwa      <NA>
#> 5  223 TWN Taiwan    4         Taiwan    5         Chiayi      <NA>
#> 6  223 TWN Taiwan    4         Taiwan    6        Hsinchu      <NA>
#>           VARNAME_2         TYPE_2            ENGTYPE_2
#> 1      Gaoxiong Shi     Chuan-shih Special Municipality
#> 2              <NA>           <NA>                 <NA>
#> 3        Taibei Shi     Chuan-shih Special Municipality
#> 4 Zhanghua|Changhua District|Hsien               County
#> 5       Jiayi|Chiai District|Hsien               County
#> 6            Xinzhu District|Hsien               County
#>                         geometry
#> 1 MULTIPOLYGON (((120.239 22....
#> 2 MULTIPOLYGON (((116.7172 20...
#> 3 MULTIPOLYGON (((121.525 25....
#> 4 MULTIPOLYGON (((120.4176 24...
#> 5 MULTIPOLYGON (((120.1526 23...
#> 6 MULTIPOLYGON (((120.9146 24...
The sf object is a special kind of data frame, with 22 rows and 12 columns. Each row corresponds to one feature, and each column has some data about each feature. One of the columns is the geometry for each feature. This is a list-column – a special type of column where each of the 22 elements contains one or more matrices of numbers representing the shape of the feature.
Columns in the data can be mapped to aesthetics like fill. For example, we can mapp the ENGTYPE_2 column to fill, as shown in Figure 13.40:
# Remove rows for which ENGTYPE_2 is NA; otherwise NA will show in the legend
taiwan_shp_mod <- taiwan_shp
taiwan_shp_mod <- taiwan_shp[!is.na(taiwan_shp$ENGTYPE_2), ]

ggplot(taiwan_shp_mod) +
  geom_sf(aes(fill = ENGTYPE_2))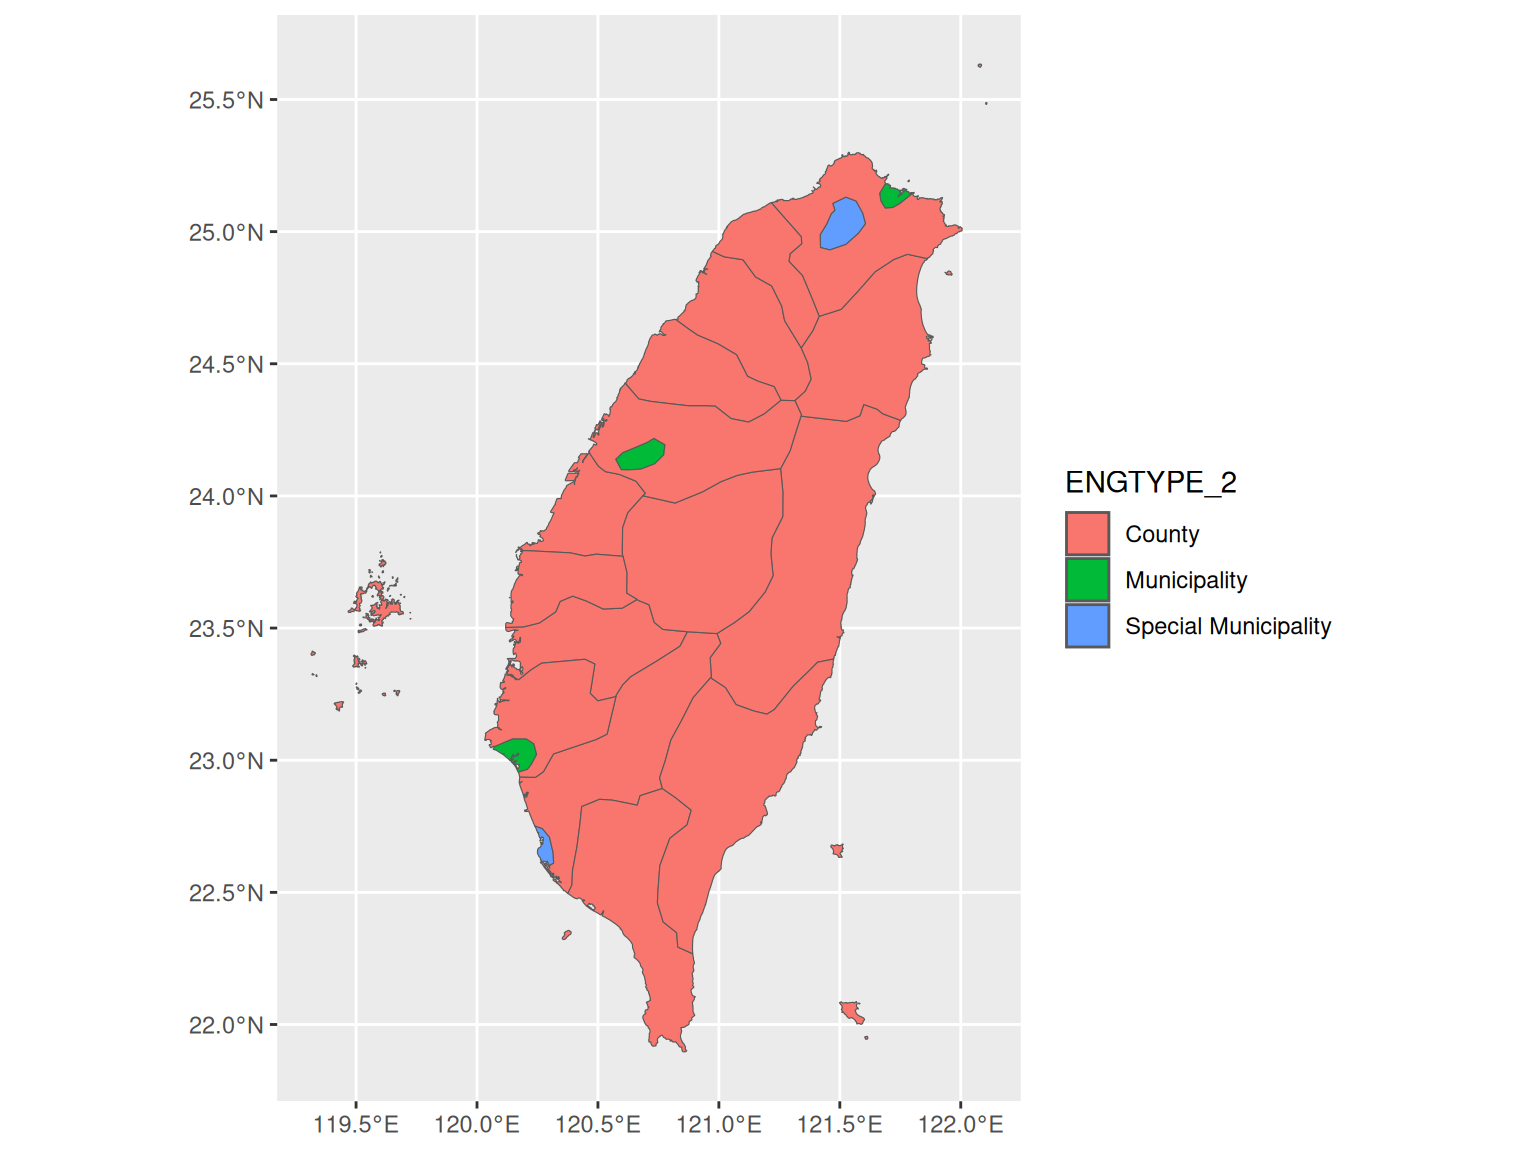
Figure 13.40: With a column mapped to fill
13.20.4 See Also
The shapefile used in this example is not included in the gcookbook package. It and many other shapefiles are available for download at http://www.gadm.org.