10.5 Changing a Legend Title
10.5.2 Solution
Use labs() and set the value of fill, colour, shape, or whatever aesthetic is appropriate for the legend (Figure 10.8):
# Create the base plot
pg_plot <- ggplot(PlantGrowth, aes(x = group, y = weight, fill = group)) +
  geom_boxplot()

pg_plot

# Set the legend title to "Condition"
pg_plot + labs(fill = "Condition")Figure 10.8: With the legend title set to “Condition”
10.5.3 Discussion
It’s also possible to set the title of the legend in the scale specification. Since legends and axes are both guides, this works the same way as setting the title of the x- or y-axis.
This would have the same effect as the previous code:
If there are multiple variables mapped to aesthetics with a legend (those other than x and y), you can set the title of each individually. In the example here we’ll use \n to add a line break in one of the titles (Figure 10.9):
library(gcookbook)  # Load gcookbook for the heightweight data set

# Load gcookbook for the heightweight data set
hw_plot <- ggplot(heightweight, aes(x = ageYear, y = heightIn, colour = sex)) +
  geom_point(aes(size = weightLb)) +
  scale_size_continuous(range = c(1, 4))

hw_plot

# With new legend titles
hw_plot +
  labs(colour = "Male/Female", size = "Weight\n(pounds)")
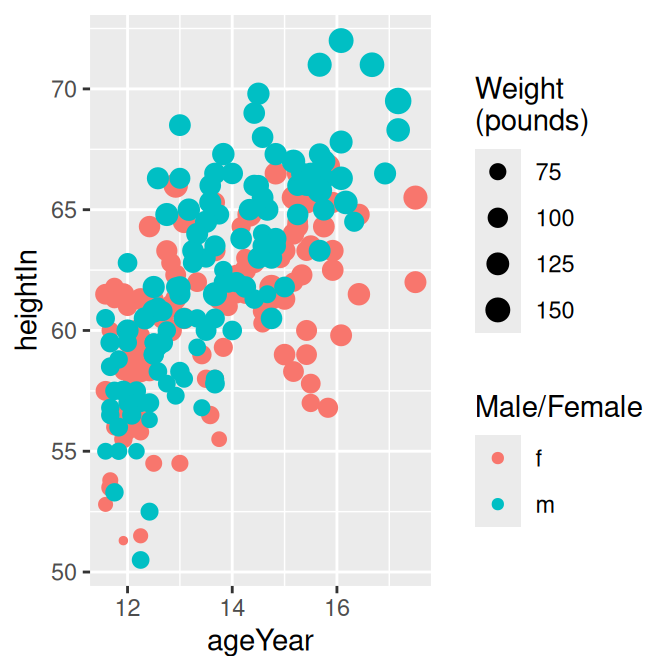
Figure 10.9: Two legends with original titles (left); With new titles (right)
If you have one variable mapped to two separate aesthetics, the default is to have a single legend that combines both. For example, if we map sex to both shape and weight, there will be just one legend (Figure 10.10, left):
hw_plot2 <- ggplot(heightweight, aes(x = ageYear, y = heightIn, shape = sex, colour = sex)) +
  geom_point()

hw_plot2
To change the title (Figure 10.10, right), you need to set the name for both of them. If you change the name for just one, it will result in two separate legends (Figure 10.10, middle):
# Change just shape
hw_plot2 +
  labs(shape = "Male/Female")

# Change both shape and colour
hw_plot2 +
  labs(shape = "Male/Female", colour = "Male/Female")
It is also possible to control the legend title with the guides() function. It’s a little more verbose, but it can be useful when you’re already using it to control other properties:
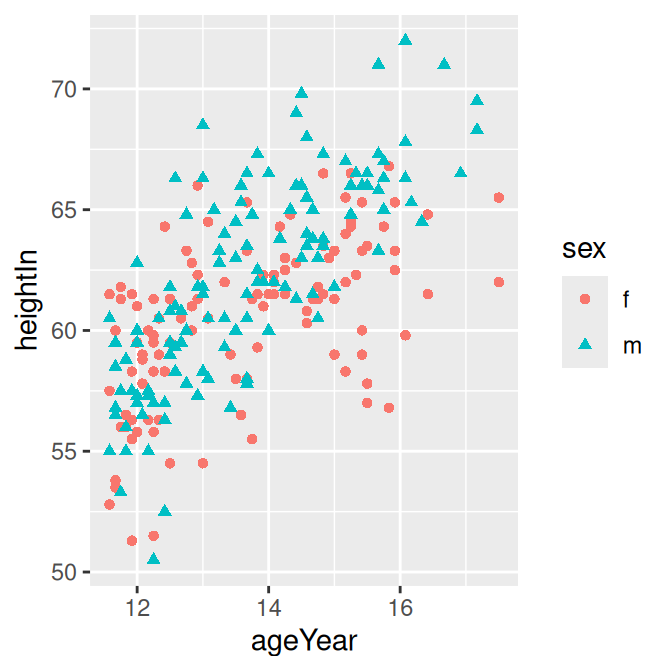
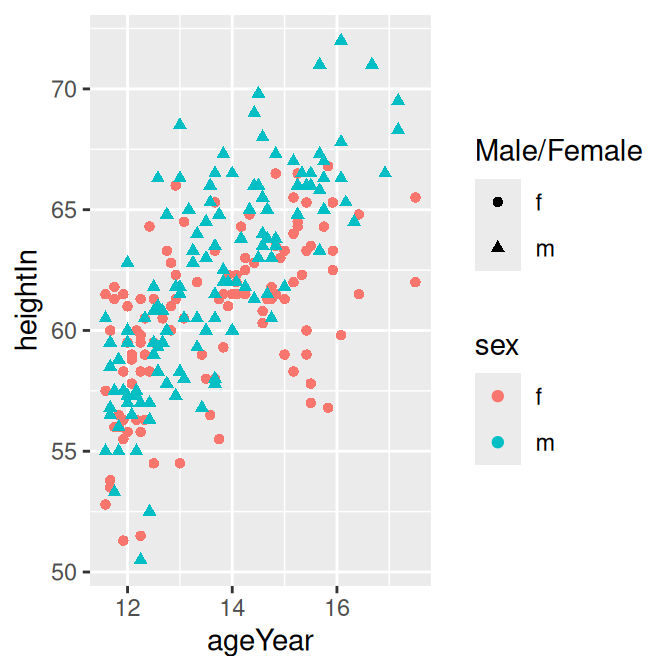
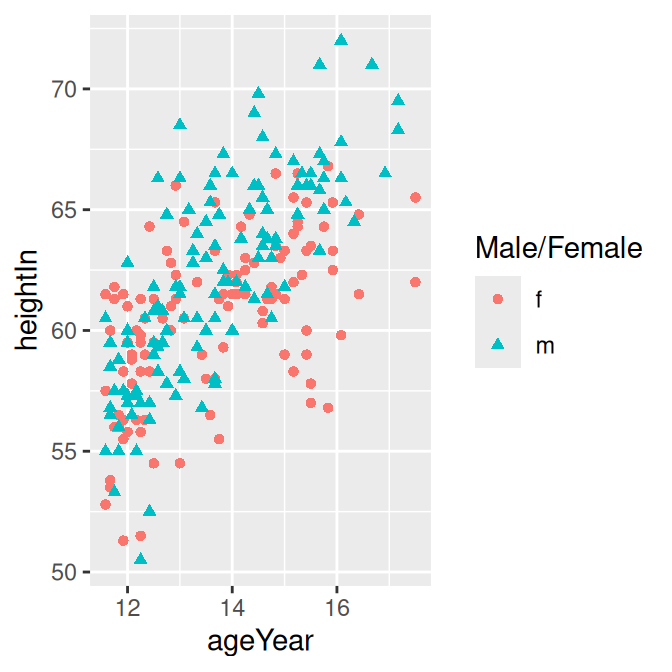
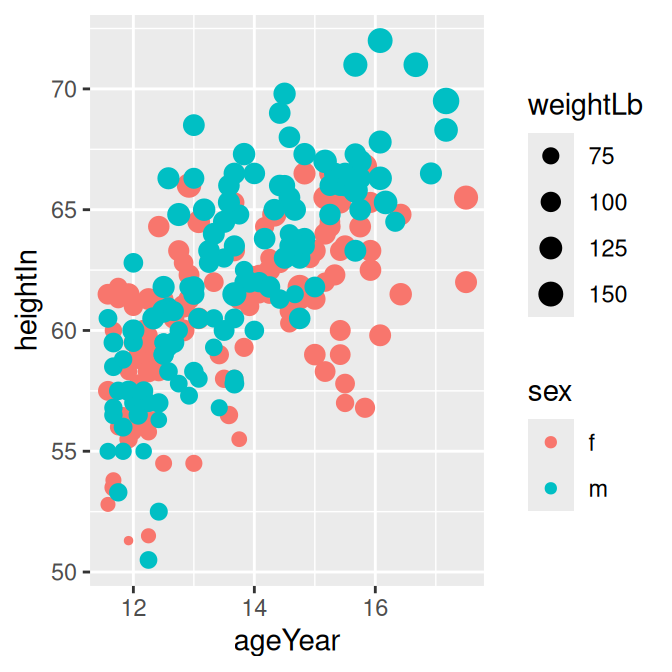
Figure 10.10: Default legend with a variable mapped to shape and colour (left); With shape renamed (middle); With both shape and colour renamed (right)