4.7 Making a Stacked Area Graph
4.7.2 Solution
Use geom_area() andmap a factor to fill (Figure 4.20):
library(gcookbook) # Load gcookbook for the uspopage data set

ggplot(uspopage, aes(x = Year, y = Thousands, fill = AgeGroup)) +
  geom_area()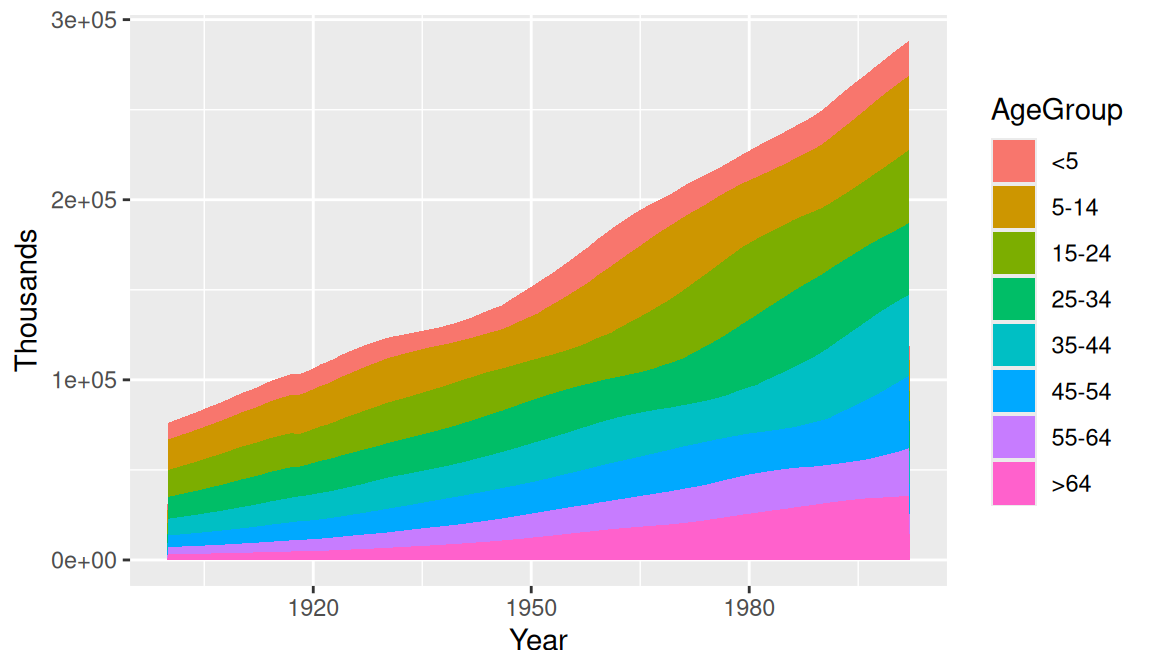
Figure 4.20: Stacked area graph
4.7.3 Discussion
The sort of data that is plotted with a stacked area chart is often provided in a wide format, but ggplot requires data to be in long format. To convert it, see Recipe 15.19.
In the example here, we used the uspopage data set:
uspopage
#>     Year AgeGroup Thousands
#> 1   1900       <5      9181
#> 2   1900     5-14     16966
#> 3   1900    15-24     14951
#>  ...<818 more rows>...
#> 822 2002    45-54     40084
#> 823 2002    55-64     26602
#> 824 2002      >64     35602
This version of the chart (Figure 4.21) changes the palette to a range of blues and adds thin (size = .2) lines between each area. It also makes the filled areas semitransparent (alpha = .4), so that it is possible to see the grid lines through them:
ggplot(uspopage, aes(x = Year, y = Thousands, fill = AgeGroup)) +
  geom_area(colour = "black", size = .2, alpha = .4) +
  scale_fill_brewer(palette = "Blues")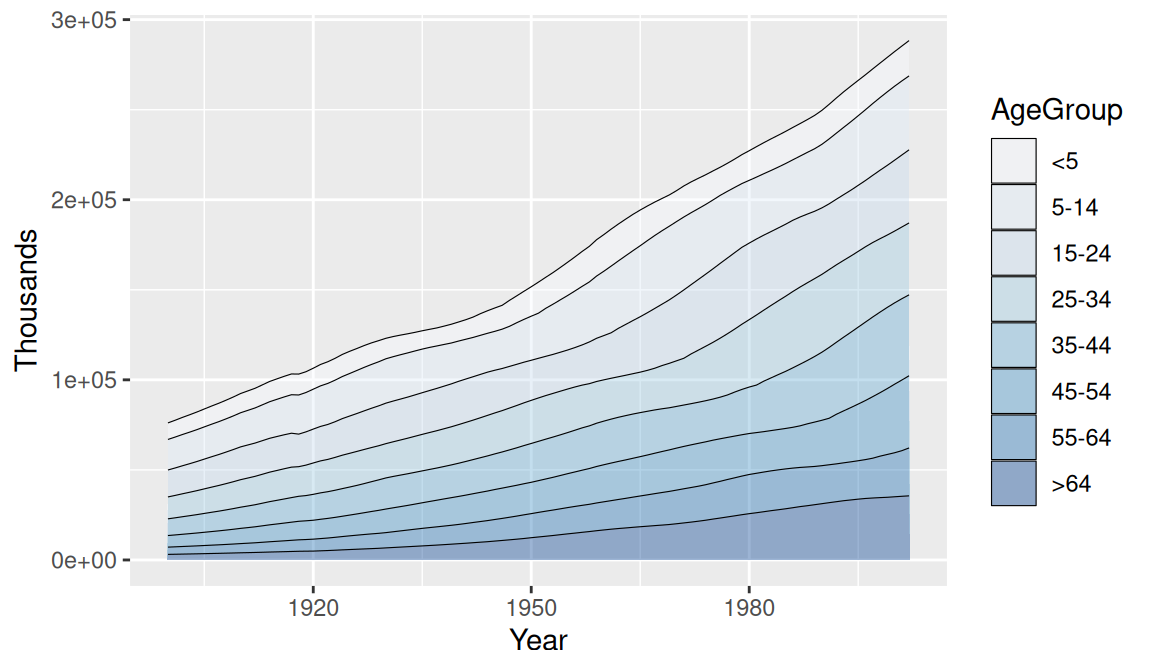
Figure 4.21: Reversed legend order, lines, and a different palette
Since each filled area is drawn with a polygon, the outline includes the left and right sides. This might be distracting or misleading. To get rid of it (Figure 4.22), first draw the stacked areas without an outline (by leaving colour as the default NA value), and then add a geom_line() on top:
ggplot(uspopage, aes(x = Year, y = Thousands, fill = AgeGroup, order = dplyr::desc(AgeGroup))) +
  geom_area(colour = NA, alpha = .4) +
  scale_fill_brewer(palette = "Blues") +
  geom_line(position = "stack", size = .2)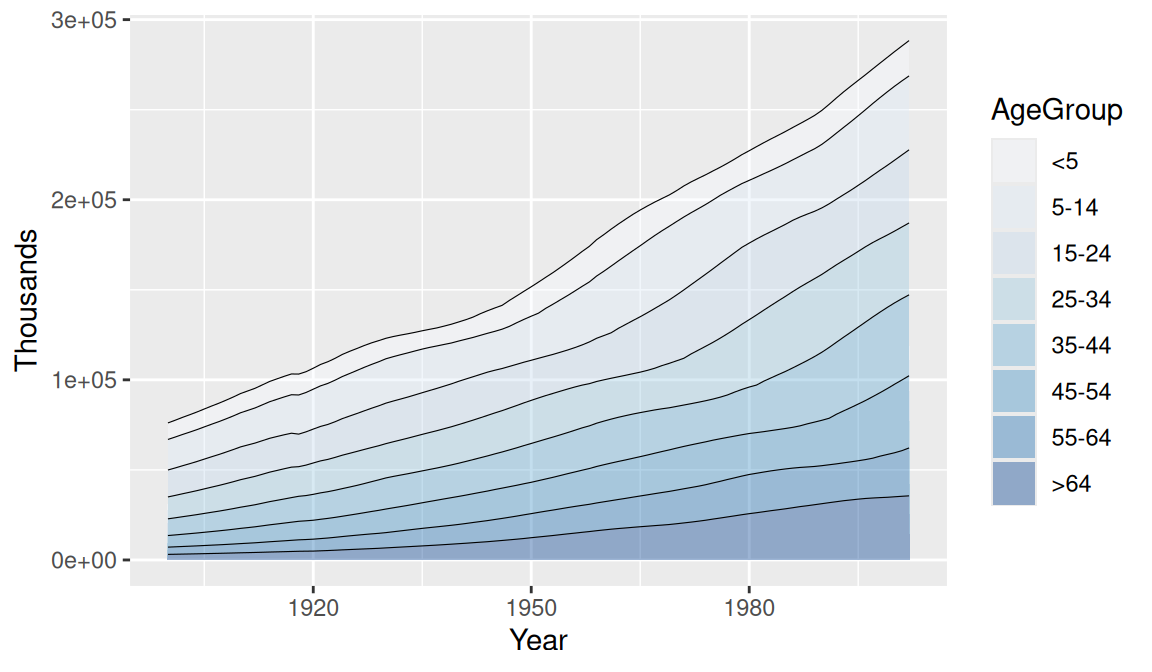
Figure 4.22: No lines on the left and right of the graph