5.2 Grouping Points Together using Shapes or Colors
5.2.1 Problem
You want to visually group points by some variable (the grouping variable), using different shapes or colors.
5.2.2 Solution
Map the grouping variable to the aesthetic of shape or colour. We’ll use three columns from the heightweight data set for this example:
library(gcookbook) # Load gcookbook for the heightweight data set

# Show the head of the three columns we'll use
heightweight %>%
  select(sex, ageYear, heightIn)
#>     sex ageYear heightIn
#> 1     f   11.92     56.3
#> 2     f   12.92     62.3
#> 3     f   12.75     63.3
#>  ...<230 more rows>...
#> 235   m   13.67     61.5
#> 236   m   13.92     62.0
#> 237   m   12.58     59.3
We can use the aesthetics of colour or shape to visually differentiate the data points belonging to different categories of sex. We do this by mapping sex to one of the aesthetics colour or shape (Figure5.3):
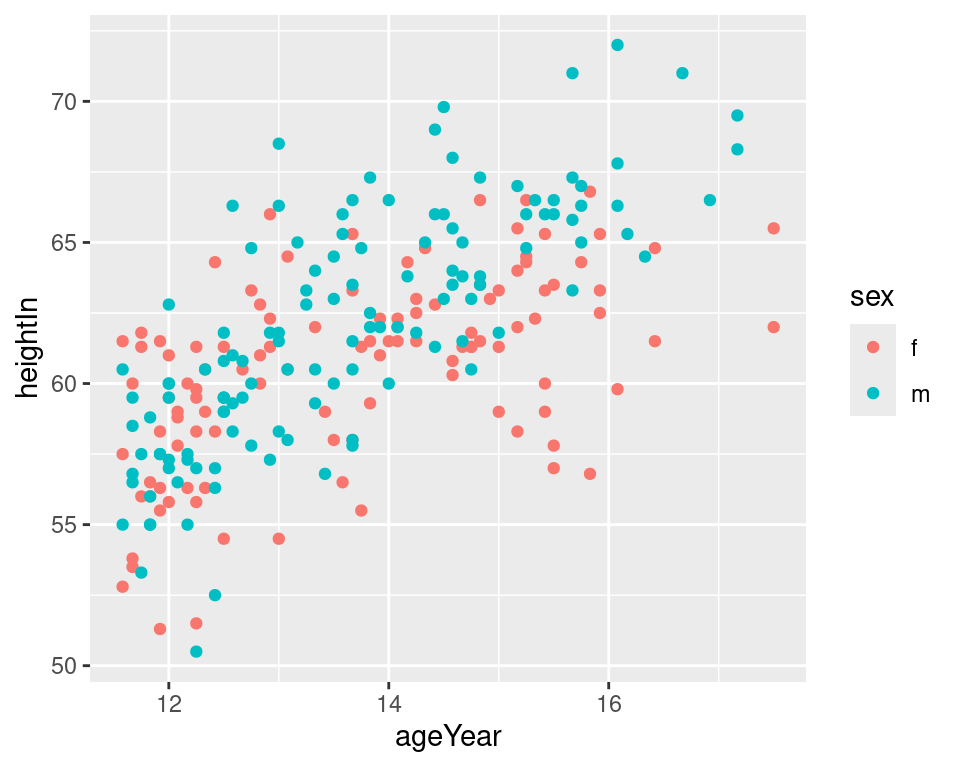
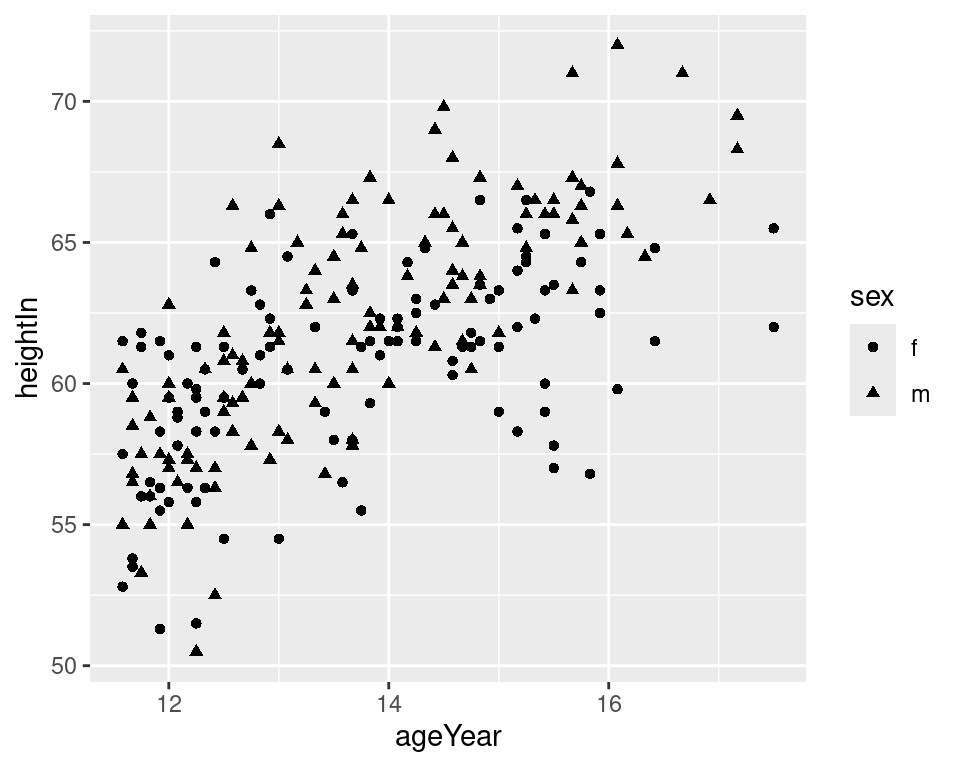
Figure 5.3: Grouping points by a variable mapped to colour (left), or to shape (right)
5.2.3 Discussion
The grouping variable you choose must be categorical – in other words, a factor or character vector. If the grouping variable is a numeric vector, you should convert it to a factor first.
It is possible to map a variable to both shape and colour, or, if you have multiple grouping variables, to map each grouping variable to a different aesthetic. Here, we’ll map the variable sex to both shape and colour aesthetics (Figure 5.4, left):
You may want to use different shapes and colors than are given by the default settings. You can select other shapes for the grouping variables using scale_shape_manual(), and select other colors using scale_colour_brewer() or scale_colour_manual(). (Figure 5.4, right):
ggplot(heightweight, aes(x = ageYear, y = heightIn, shape = sex, colour = sex)) +
geom_point() +
scale_shape_manual(values = c(1,2)) +
scale_colour_brewer(palette = "Set1")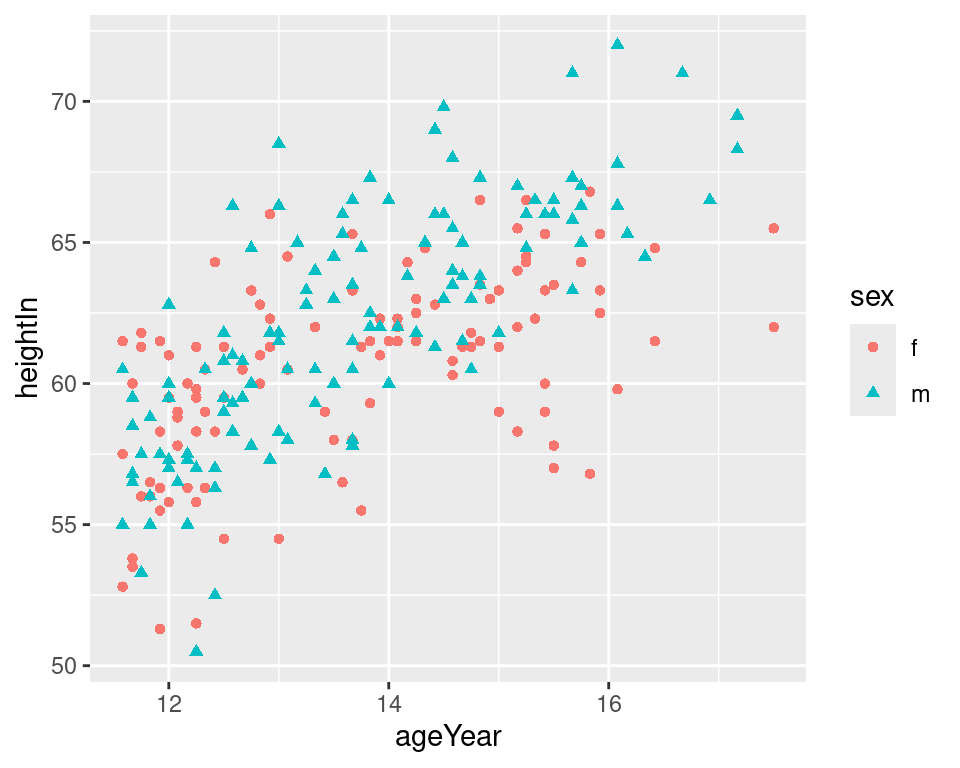
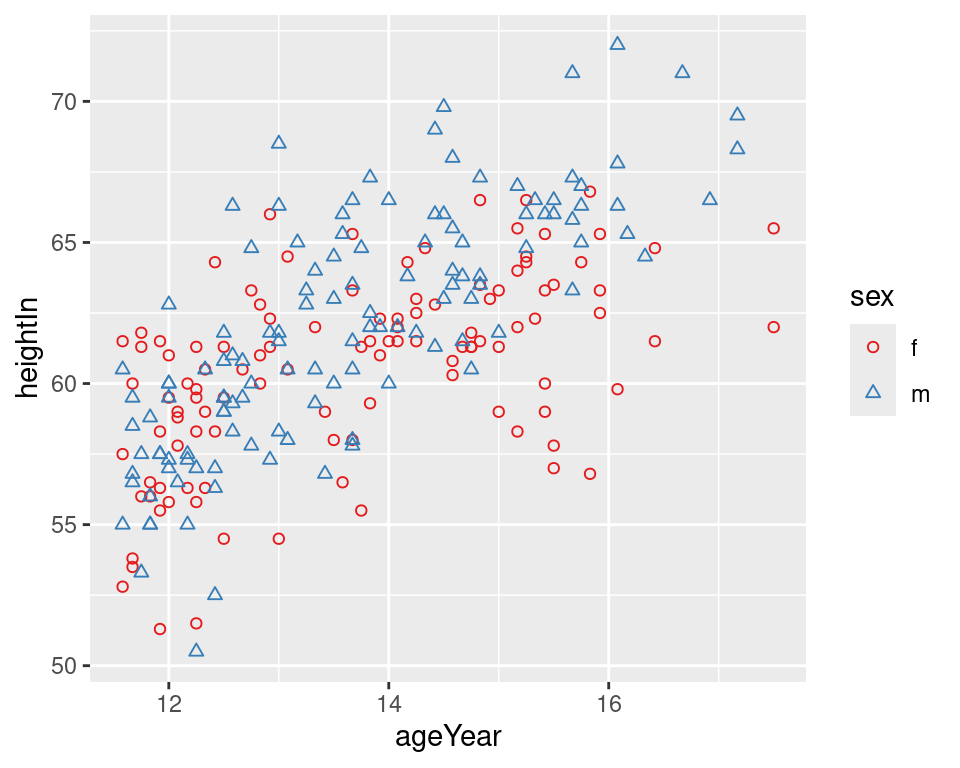
Figure 5.4: Mapping to both shape and colour (left); With manually set shapes and colors (right)