2.6 Plotting a Function Curve
2.6.2 Solution
To plot a function curve, as in Figure 2.12, use curve() and pass it an expression with the variable x:
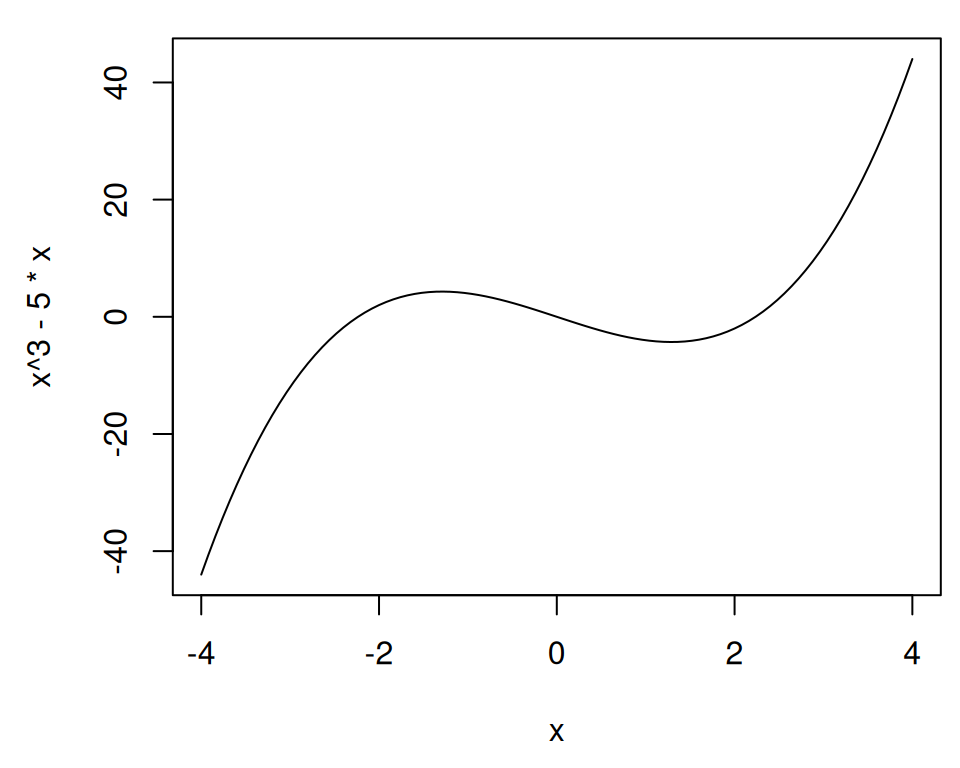
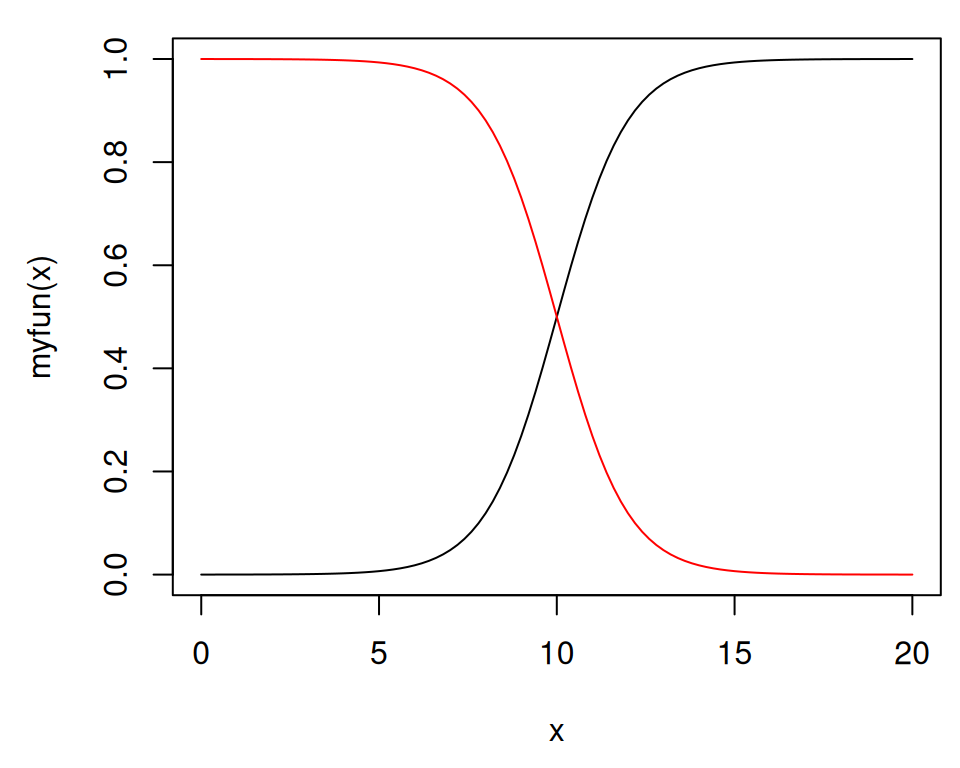
Figure 2.12: Function curve with base graphics (left); With user-defined function (right)
You can plot any function that takes a numeric vector as input and returns a numeric vector, including functions that you define yourself. Using add = TRUE will add a curve to the previously created plot:
# Plot a user-defined function
myfun <- function(xvar) {
  1 / (1 + exp(-xvar + 10))
}
curve(myfun(x), from = 0, to = 20)
# Add a line:
curve(1 - myfun(x), add = TRUE, col = "red")
With ggplot2, you can get a similar result (Figure 2.13), by using stat_function(geom = "line") and passing it a function that takes a numeric vector as input and returns a numeric vector:
library(ggplot2)
# This sets the x range from 0 to 20
ggplot(data.frame(x = c(0, 20)), aes(x = x)) +
  stat_function(fun = myfun, geom = "line")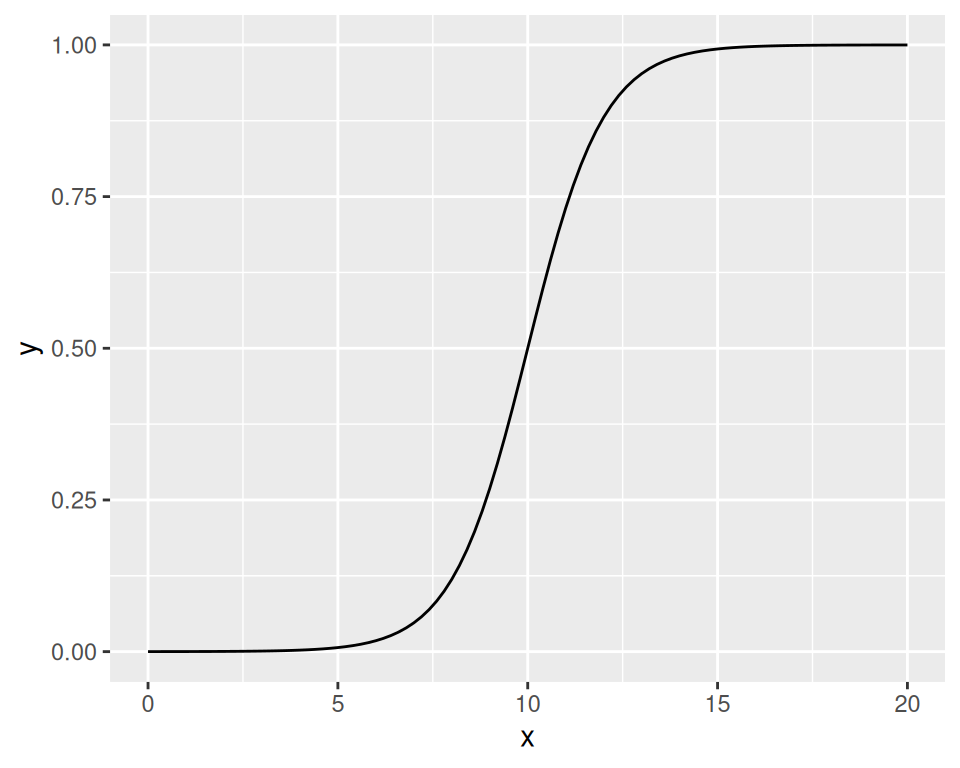
Figure 2.13: A function curve with ggplot2
2.6.3 See Also
See Recipe 13.2 for more in-depth information about plotting function curves.