4.8 Making a Proportional Stacked Area Graph
4.8.1 Problem
You want to make a stacked area graph with the overall height scaled to a constant value.
4.8.2 Solution
Use geom_area(position = "fill"), as in Figure 4.23, left:
4.8.3 Discussion
With position="fill", the y values will be scaled to go from 0 to 1. To print the labels as percentages, use scale_y_continuous(labels = scales::percent), as in Figure 4.23, right:
ggplot(uspopage, aes(x = Year, y = Thousands, fill = AgeGroup)) +
  geom_area(position = "fill", colour = "black", size = .2, alpha = .4) +
scale_fill_brewer(palette = "Blues") +
scale_y_continuous(labels = scales::percent)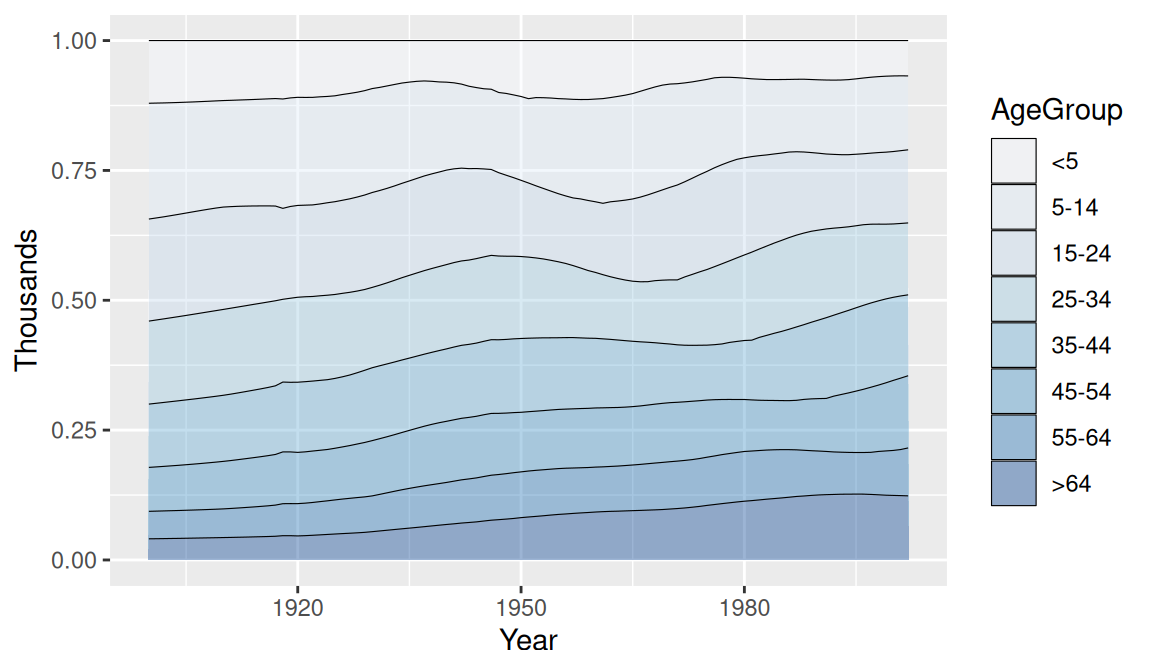
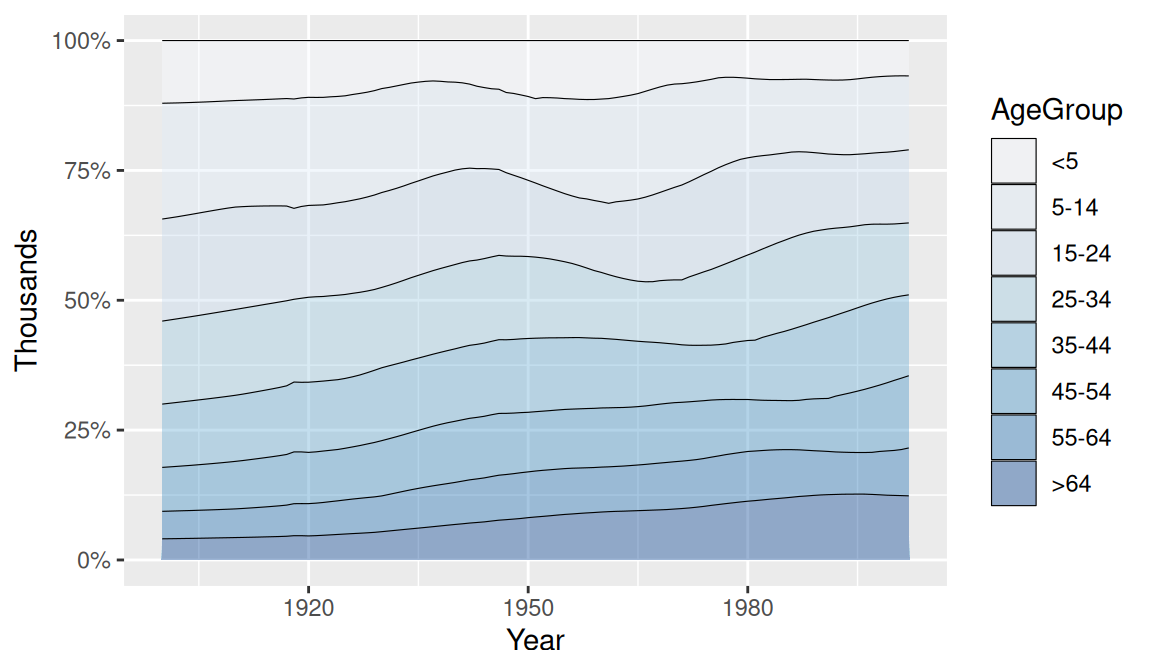
Figure 4.23: A proportional stacked area graph