8.13 Showing Lines Along the Axes
8.13.1 Problem
You want to display lines along the x- and y-axes, but not on the other sides of the graph.
8.13.2 Solution
Using themes, use axis.line (Figure 8.24):
8.13.3 Discussion
If you are starting with a theme that has a border around the plotting area, like theme_bw(), you will also need to unset panel.border (Figure 8.24, right):
hw_plot +
  theme_bw() +
  theme(panel.border = element_blank(), axis.line = element_line(colour = "black"))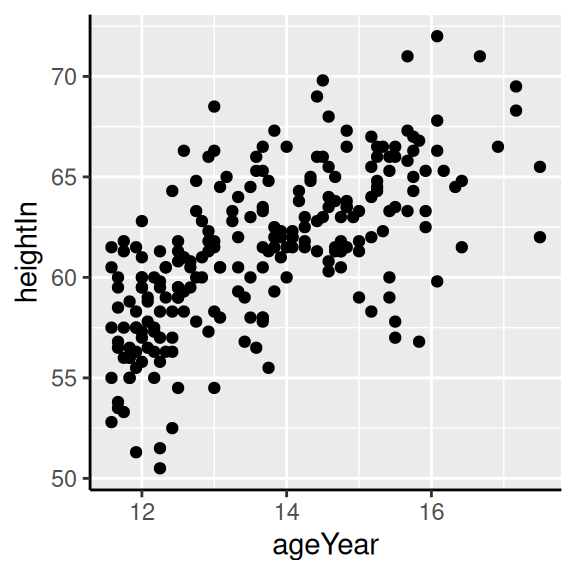
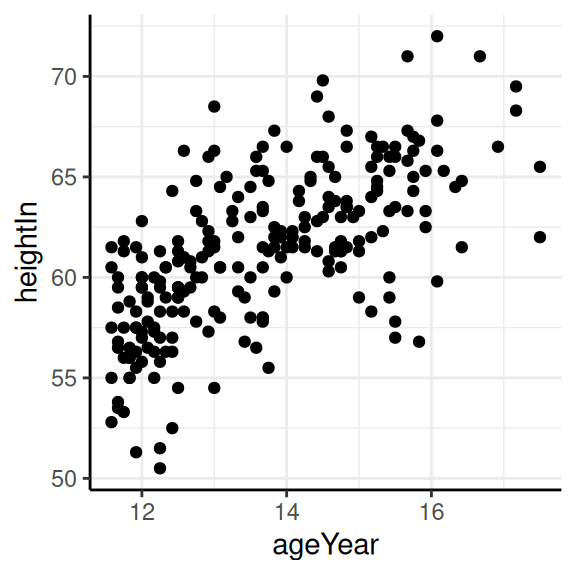
Figure 8.24: Scatter plot with axis lines (left); With theme_bw(), panel.border must also be made blank (right)
If the lines are thick, the ends will only partially overlap (Figure 8.25, left). To make them fully overlap (Figure 8.25, right), set lineend = "square":
# With thick lines, only half overlaps
hw_plot +
  theme_bw() +
  theme(
    panel.border = element_blank(),
    axis.line = element_line(colour = "black", size = 4)
  )
#> Warning: The `size` argument of `element_line()` is deprecated as of ggplot2 3.4.0.
#> ℹ Please use the `linewidth` argument instead.
#> This warning is displayed once per session.
#> Call `lifecycle::last_lifecycle_warnings()` to see where this warning was
#> generated.

# Full overlap
hw_plot +
  theme_bw() +
  theme(
    panel.border = element_blank(),
    axis.line = element_line(colour = "black", size = 4, lineend = "square")
  )
<img src=“R-Graphics-Cookbook-2e_files/figure-html/FIG-AXES-AXIS-LINE-LINEEND-1.png” alt=“With thick lines, the ends don’t fully overlap (left); Full overlap with
lineend="square" (right)” width=“288” /><img src=“R-Graphics-Cookbook-2e_files/figure-html/FIG-AXES-AXIS-LINE-LINEEND-2.png” alt=“With thick lines, the ends don’t fully overlap (left); Full overlap with lineend="square" (right)” width=“288” />
Figure 8.25: With thick lines, the ends don’t fully overlap (left); Full overlap with lineend="square" (right)
8.13.4 See Also
For more information about how the theming system works, see Recipe 9.3.