13.4 Creating a Network Graph
13.4.2 Solution
Use the igraph package. To create a graph, pass a vector containing pairs of items to graph(), then plot the resulting object (Figure 13.7):
# May need to install first, with install.packages("igraph")
library(igraph)

# Specify edges for a directed graph
gd <- graph(c(1,2, 2,3, 2,4, 1,4, 5,5, 3,6))
#> Warning: `graph()` was deprecated in igraph 2.1.0.
#> ℹ Please use `make_graph()` instead.
#> This warning is displayed once per session.
#> Call `lifecycle::last_lifecycle_warnings()` to see where this warning was
#> generated.
plot(gd)

# For an undirected graph
gu <- graph(c(1,2, 2,3, 2,4, 1,4, 5,5, 3,6), directed = FALSE)
# No labels
plot(gu, vertex.label = NA)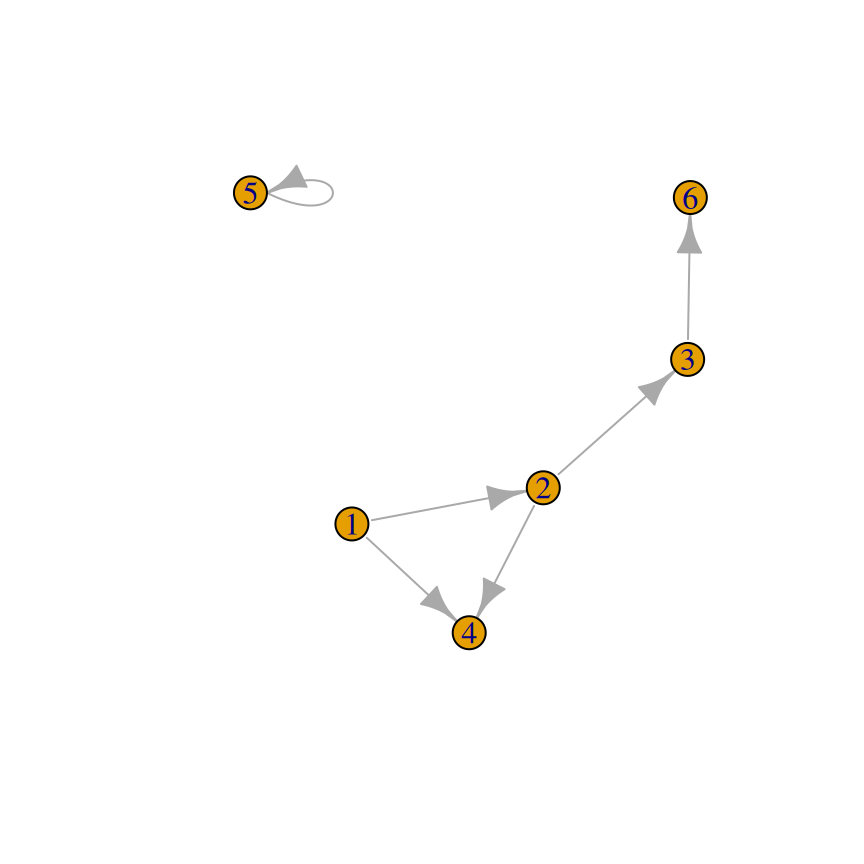
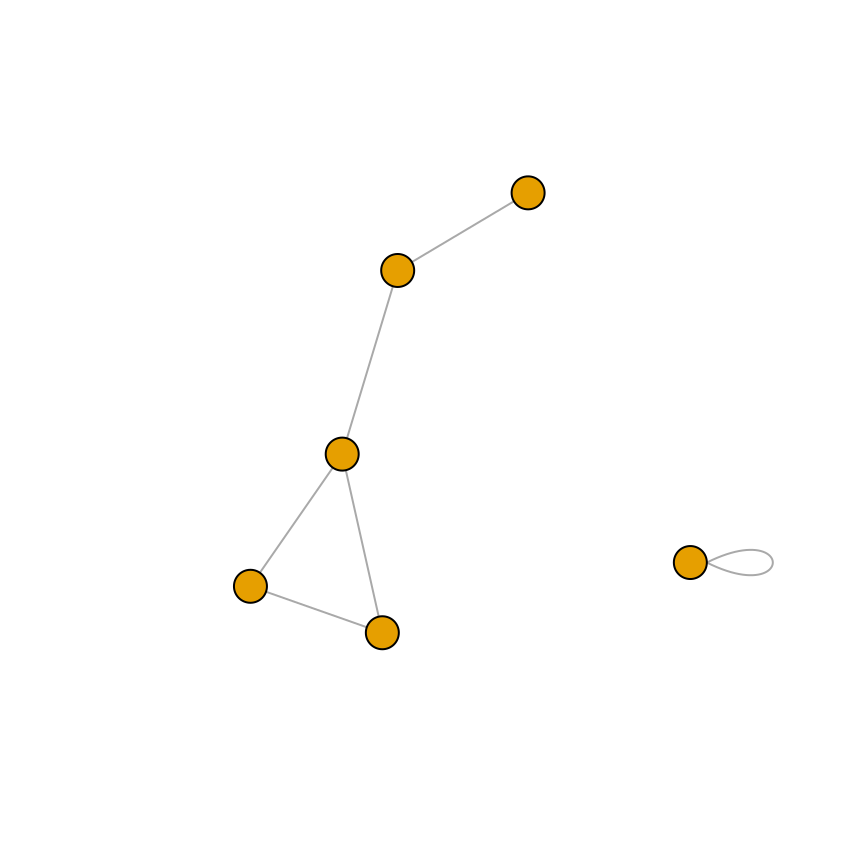
Figure 13.7: A directed graph (left); An undirected graph, with no vertex labels (right)
This is the structure of each of the graph objects:
13.4.3 Discussion
In a network graph, the position of the nodes is unspecified by the data, and they’re placed randomly. To make the output repeatable, you can set the random seed before making the plot. You can try different random numbers until you get a result that you like:
It’s also possible to create a graph from a data frame. The first two columns of the data frame are used, and each row specifies a connection between two nodes. In the next example (Figure 13.8), we’ll use the madmen2 data set, which has this structure. We’ll also use the Fruchterman-Reingold layout algorithm. The idea is that all the nodes have a magnetic repulsion from one another, but the edges between nodes act as springs, pulling the nodes together:
library(gcookbook) # For the data set
madmen2
#>                       Name1          Name2
#> 1               Abe Drexler    Peggy Olson
#> 2                   Allison     Don Draper
#> 3               Arthur Case   Betty Draper
#>  ...<81 more rows>...
#> 85                    Vicky Roger Sterling
#> 86                 Waitress     Don Draper
#> 87 Woman at the Clios party     Don Draper
# Create a graph object from the data set
g <- graph.data.frame(madmen2, directed=TRUE)
#> Warning: `graph.data.frame()` was deprecated in igraph 2.0.0.
#> ℹ Please use `graph_from_data_frame()` instead.
#> This warning is displayed once per session.
#> Call `lifecycle::last_lifecycle_warnings()` to see where this warning was
#> generated.
# Remove unnecessary margins
par(mar = c(0, 0, 0, 0))
plot(g, layout = layout.fruchterman.reingold, vertex.size = 8,
     edge.arrow.size = 0.5, vertex.label = NA)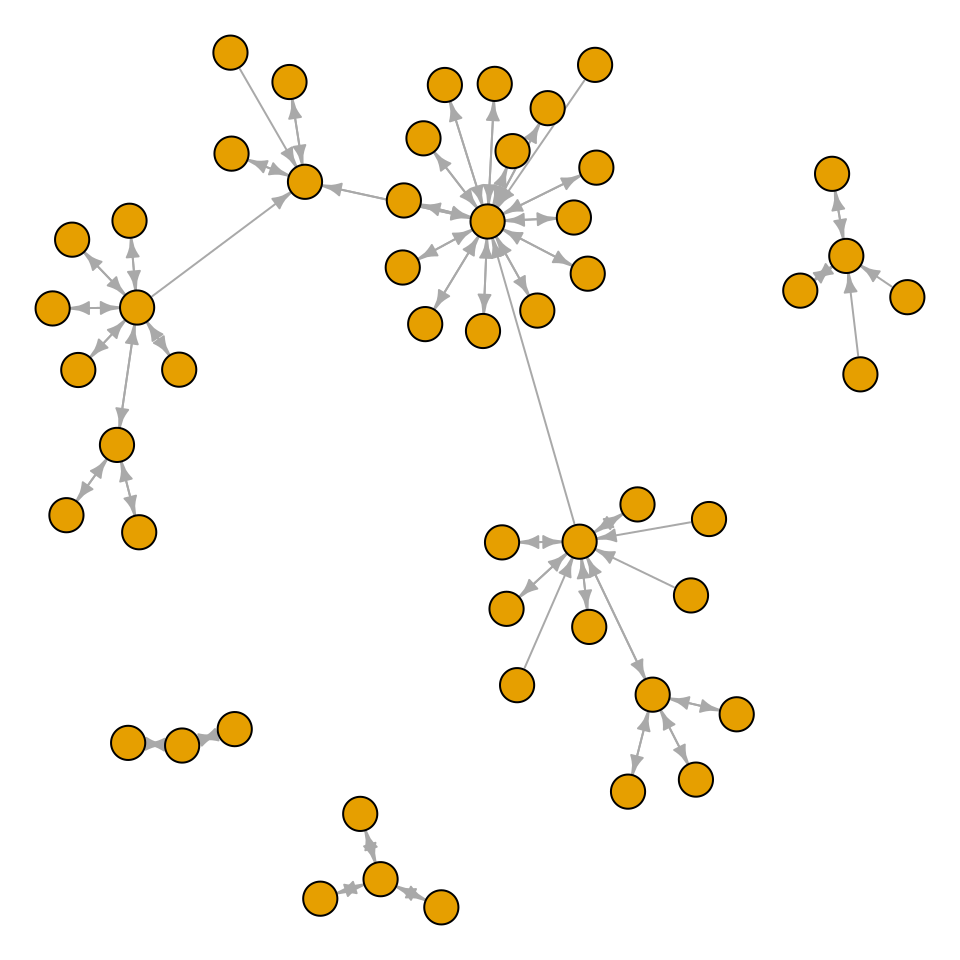
Figure 13.8: A directed graph from a data frame, with the Fruchterman-Reingold algorithm
It’s also possible to make a directed graph from a data frame. The madmen data set has only one row for each pairing, since direction doesn’t matter for an undirected graph. This time we’ll use a circle layout (Figure 13.9):
g <- graph.data.frame(madmen, directed = FALSE)
par(mar = c(0, 0, 0, 0))  # Remove unnecessary margins
plot(g, layout = layout.circle, vertex.size = 8, vertex.label = NA)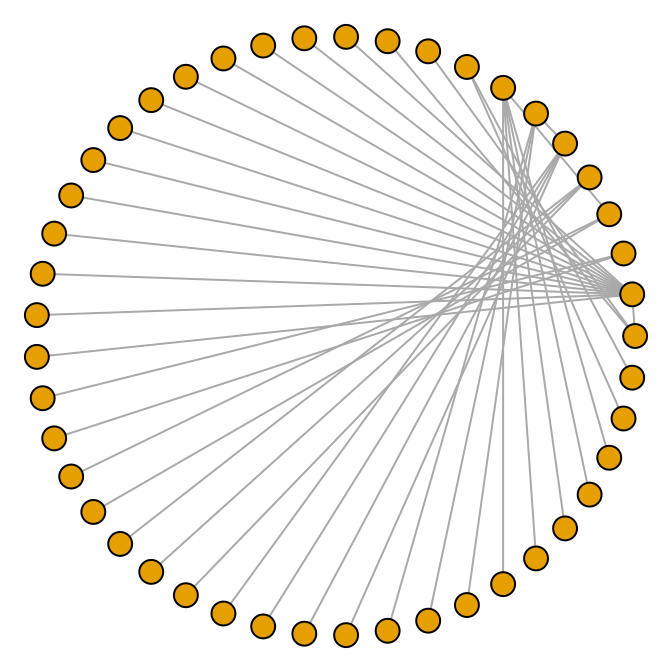
Figure 13.9: A circular undirected graph from a data frame
13.4.4 See Also
For more information about the available output options, see ?plot.igraph. Also see ?igraph::layout for layout options.
An alternative to igraph is Rgraphviz, which a frontend for Graphviz, an open-source library for visualizing graphs. It works better with labels and makes it easier to create graphs with a controlled layout, but it can be a bit challenging to install. Rgraphviz is available through the Bioconductor repository system.