4.9 Adding a Confidence Region
4.9.2 Solution
Use geom_ribbon() and map values to ymin and ymax.
In the climate data set, Anomaly10y is a 10-year running average of the deviation (in Celsius) from the average 1950–1980 temperature, and Unc10y is the 95% confidence interval. We’ll set ymax and ymin to Anomaly10y plus or minus Unc10y (Figure 4.24):
library(gcookbook) # Load gcookbook for the climate data set
library(dplyr)

# Grab a subset of the climate data
climate_mod <- climate %>%
  filter(Source == "Berkeley") %>%
  select(Year, Anomaly10y, Unc10y)

climate_mod
#>     Year Anomaly10y Unc10y
#> 1   1800     -0.435  0.505
#> 2   1801     -0.453  0.493
#> 3   1802     -0.460  0.486
#>  ...<199 more rows>...
#> 203 2002      0.856  0.028
#> 204 2003      0.869  0.028
#> 205 2004      0.884  0.029

# Shaded region
ggplot(climate_mod, aes(x = Year, y = Anomaly10y)) +
  geom_ribbon(aes(ymin = Anomaly10y - Unc10y, ymax = Anomaly10y + Unc10y), alpha = 0.2) +
  geom_line()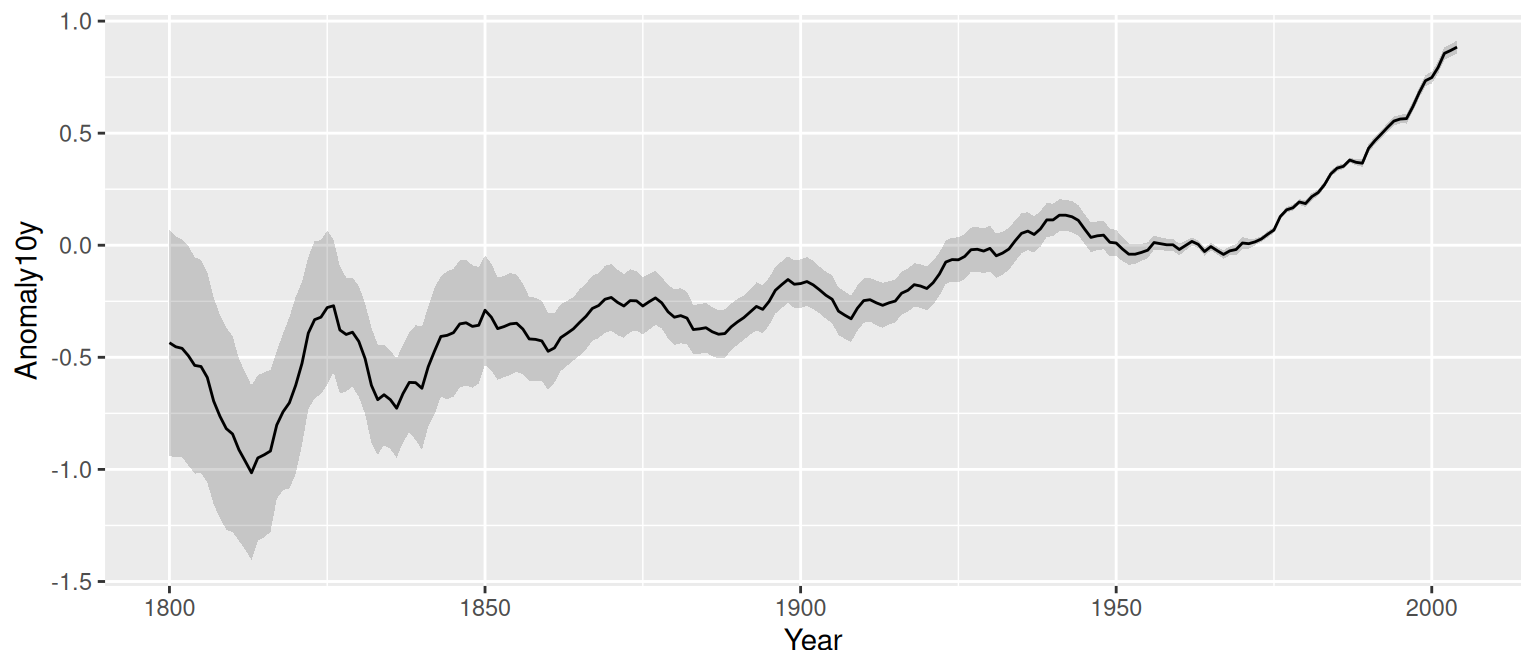
Figure 4.24: A line graph with a shaded confidence region
The shaded region is actually a very dark grey, but it is mostly transparent. The transparency is set with alpha = 0.2, which makes it 80% transparent.
4.9.3 Discussion
Notice that the geom_ribbon() comes before geom_line(), so that the line is drawn on top of the shaded region. If the reverse order were used, the shaded region could obscure the line. In this particular case that wouldn’t be a problem since the shaded region is mostly transparent, but it would be a problem if the shaded region were opaque.
Instead of a shaded region, you can also use dotted lines to represent the upper and lower bounds (Figure 4.25):
# With a dotted line for upper and lower bounds
ggplot(climate_mod, aes(x = Year, y = Anomaly10y)) +
  geom_line(aes(y = Anomaly10y - Unc10y), colour = "grey50", linetype = "dotted") +
  geom_line(aes(y = Anomaly10y + Unc10y), colour = "grey50", linetype = "dotted") +
  geom_line()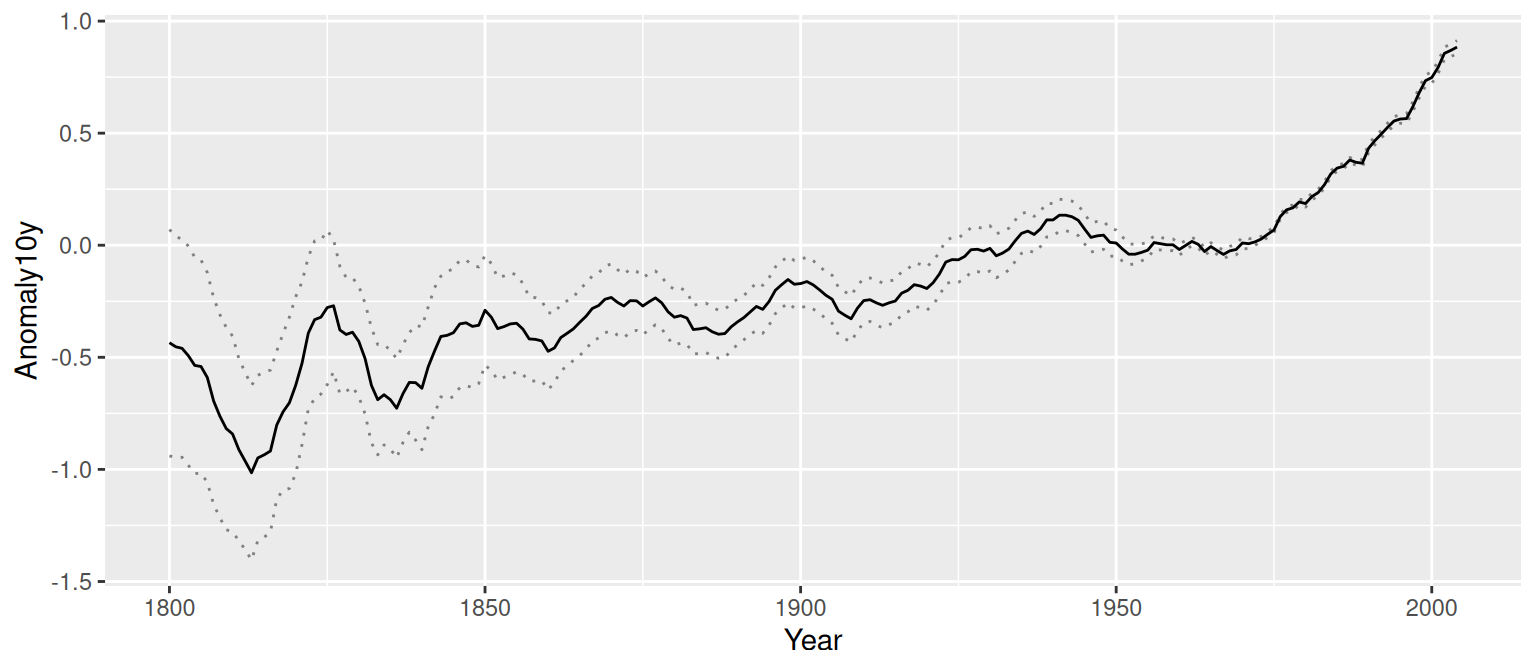
Figure 4.25: A line graph with dotted lines representing a confidence region
Shaded regions can represent things other than confidence regions, such as the difference between two values, for example.
In the area graphs in Recipe 4.7, the y range of the shaded area goes from 0 to y. Here, it goes from ymin to ymax.