8.15 Adding Ticks for a Logarithmic Axis
8.15.2 Solution
Use annotation_logticks() (Figure 8.31):
library(MASS)   # Load MASS for the Animals data set
library(scales) # For the trans_format function

# Given a vector x, return a vector of powers of 10 that encompasses all values
# in x.
breaks_log10 <- function(x) {
  low <- floor(log10(min(x)))
  high <- ceiling(log10(max(x)))

  10^(seq.int(low, high))
}

ggplot(Animals, aes(x = body, y = brain, label = rownames(Animals))) +
  geom_text(size = 3) +
  annotation_logticks() +
  scale_x_log10(breaks = breaks_log10,
                labels = trans_format(log10, math_format(10^.x))) +
  scale_y_log10(breaks = breaks_log10,
                labels = trans_format(log10, math_format(10^.x)))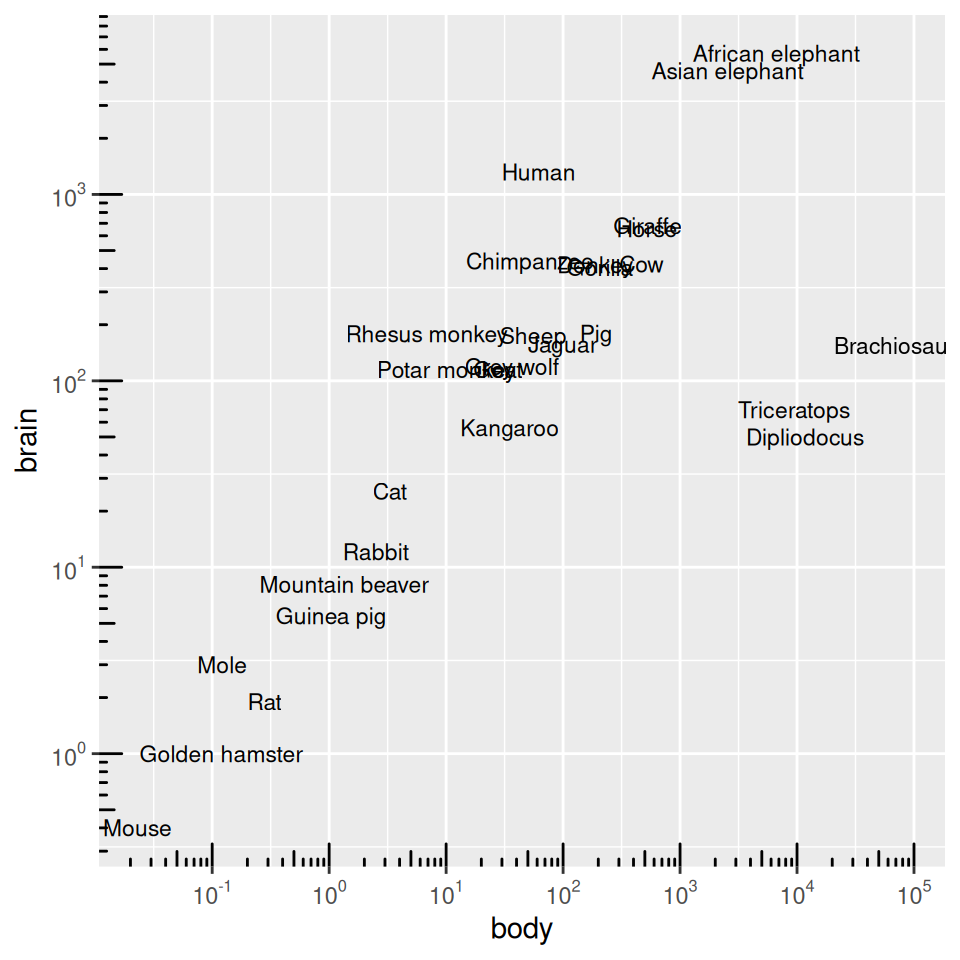
Figure 8.31: Log axes with diminishing tick marks
We also defined a function, breaks_log10(), which returns all powers of 10 that encompass the range of values passed to it. This tells scale_x_log10 where to put the breaks. For example:
8.15.3 Discussion
The tick marks created by annotation_logticks() are actually geoms inside the plotting area. There is a long tick mark at each power of 10, and a mid-length tick mark at each 5.
To get the colors of the tick marks and the grid lines to match up a bit better, you can use theme_bw().
By default, the minor grid lines appear visually halfway between the major grid lines, but this is not the same place as the “5” tick marks on a logarithmic scale. To get them to be the same, we can supply a function for the scales minor_breaks.
We’ll define breaks_5log10(), which returns 5 times powers of 10 that encompass the values passed to it.
breaks_5log10 <- function(x) {
  low <- floor(log10(min(x)/5))
  high <- ceiling(log10(max(x)/5))

  5 * 10^(seq.int(low, high))
}

breaks_5log10(c(0.12, 6))
#> [1]  0.05  0.50  5.00 50.00
Then we’ll use that function for the minor breaks (Figure 8.32):
ggplot(Animals, aes(x = body, y = brain, label = rownames(Animals))) +
  geom_text(size = 3) +
  annotation_logticks() +
  scale_x_log10(breaks = breaks_log10,
                minor_breaks = breaks_5log10,
                labels = trans_format(log10, math_format(10^.x))) +
  scale_y_log10(breaks = breaks_log10,
                minor_breaks = breaks_5log10,
                labels = trans_format(log10, math_format(10^.x))) +
  coord_fixed() +
  theme_bw()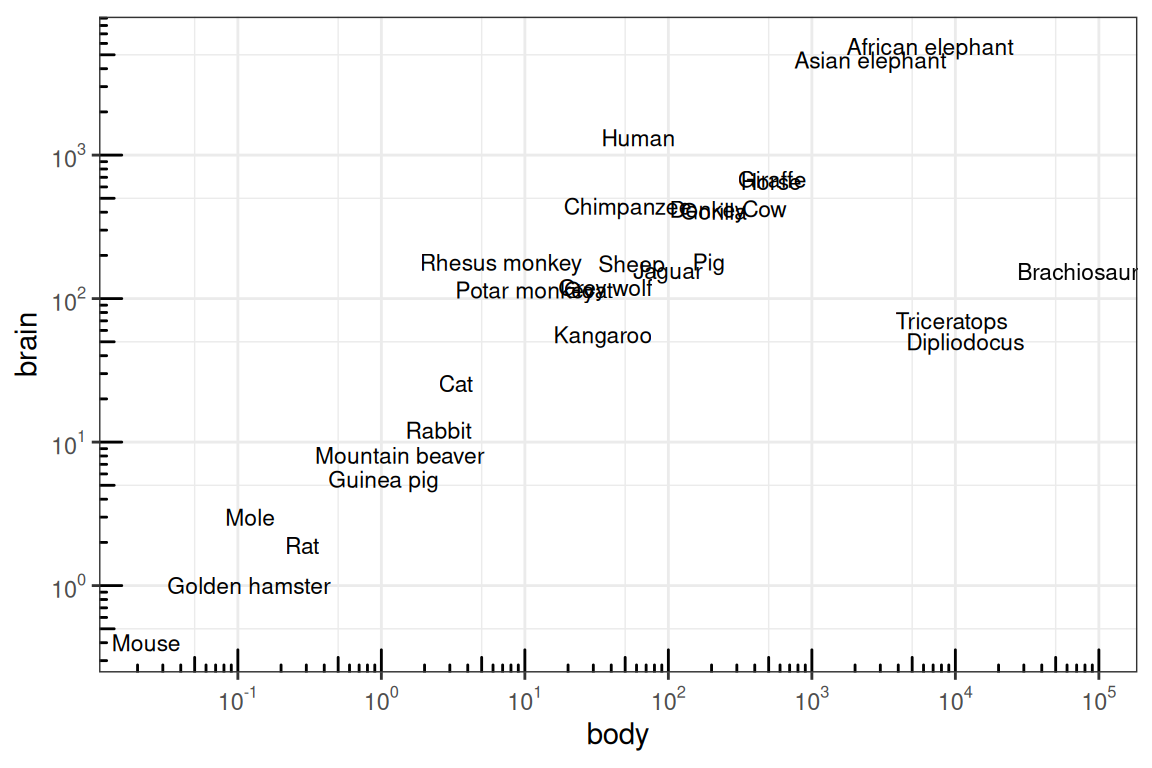
Figure 8.32: Log axes with ticks at each 5, and fixed coordinate ratio