8.10 Changing the Text of Axis Labels
8.10.2 Solution
Use xlab() or ylab() to change the text of the axis labels (Figure 8.19):
library(gcookbook)  # Load gcookbook for the heightweight data set

hw_plot <- ggplot(heightweight, aes(x = ageYear, y = heightIn, colour = sex)) +
  geom_point()

# With default axis labels
hw_plot

# Set the axis labels
hw_plot +
  xlab("Age in years") +
  ylab("Height in inches")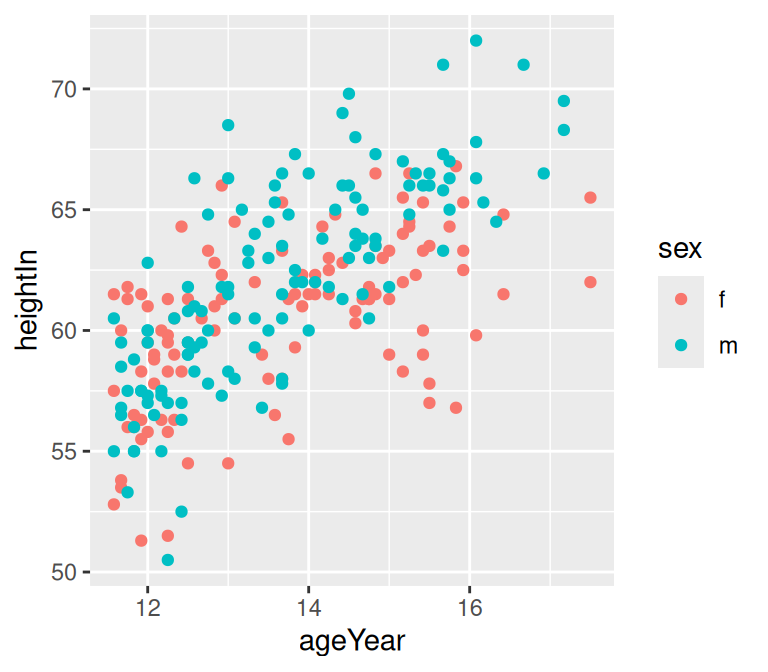
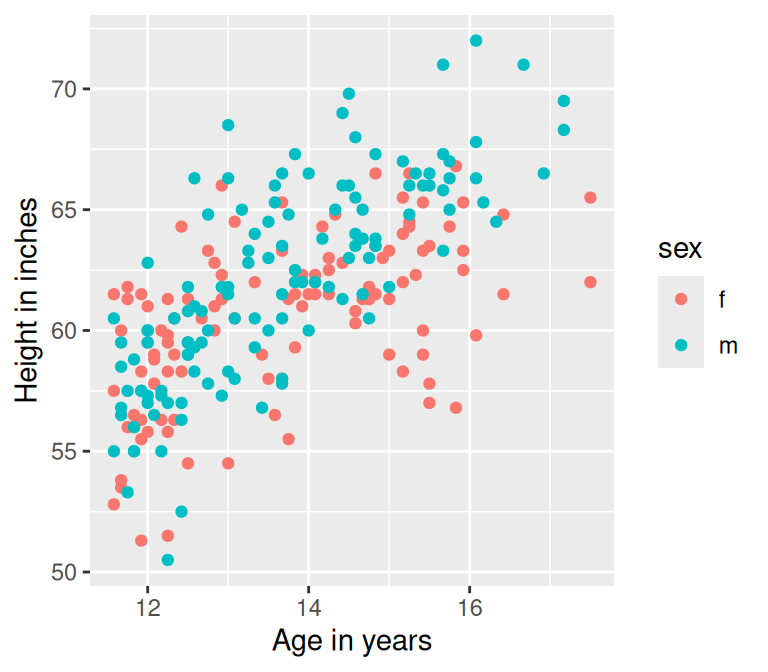
Figure 8.19: Scatter plot with the default axis labels (left); Manually specified labels for the x- and y-axes (right)
8.10.3 Discussion
By default the graphs will just use the column names from the data frame as axis labels. This might be fine for exploring data, but for presenting it, you may want more descriptive axis labels.
Instead of xlab() and ylab(), you can use labs():
Another way of setting the axis labels is in the scale specification, like this:
This may look a bit awkward, but it can be useful if you’re also setting other properties of the scale, such as the tick mark placement, range, and so on.
This also applies, of course, to other axis scales, such as scale_y_continuous(), scale_x_discrete(), and so on.
You can also add line breaks with \n, as shown in Figure 8.20:
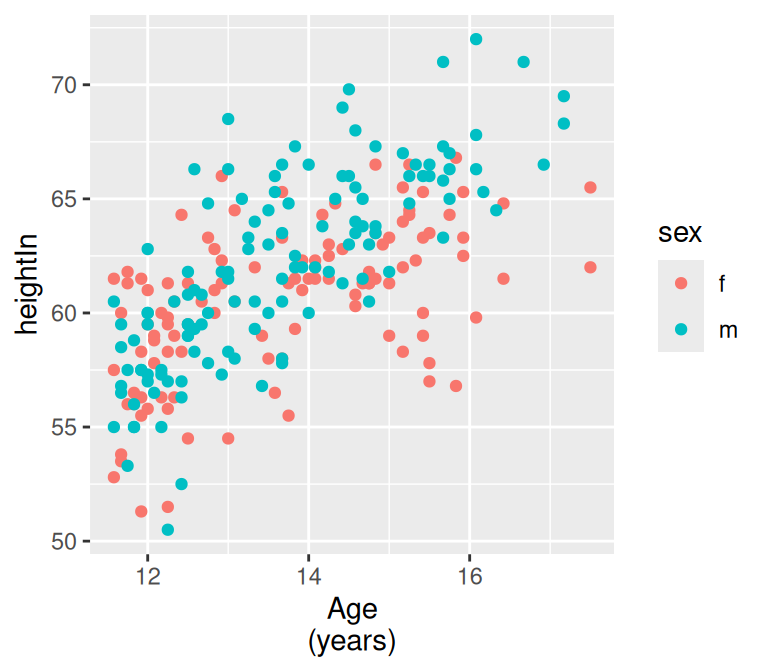
Figure 8.20: X-axis label with a line break