7.5 Adding a Shaded Rectangle
7.5.2 Solution
Use annotate("rect") (Figure 7.12):
library(gcookbook) # Load gcookbook for the climate data set

p <- ggplot(filter(climate, Source == "Berkeley"), aes(x = Year, y = Anomaly10y)) +
  geom_line()

p +
  annotate("rect", xmin = 1950, xmax = 1980, ymin = -1, ymax = 1,
           alpha = .1,fill = "blue")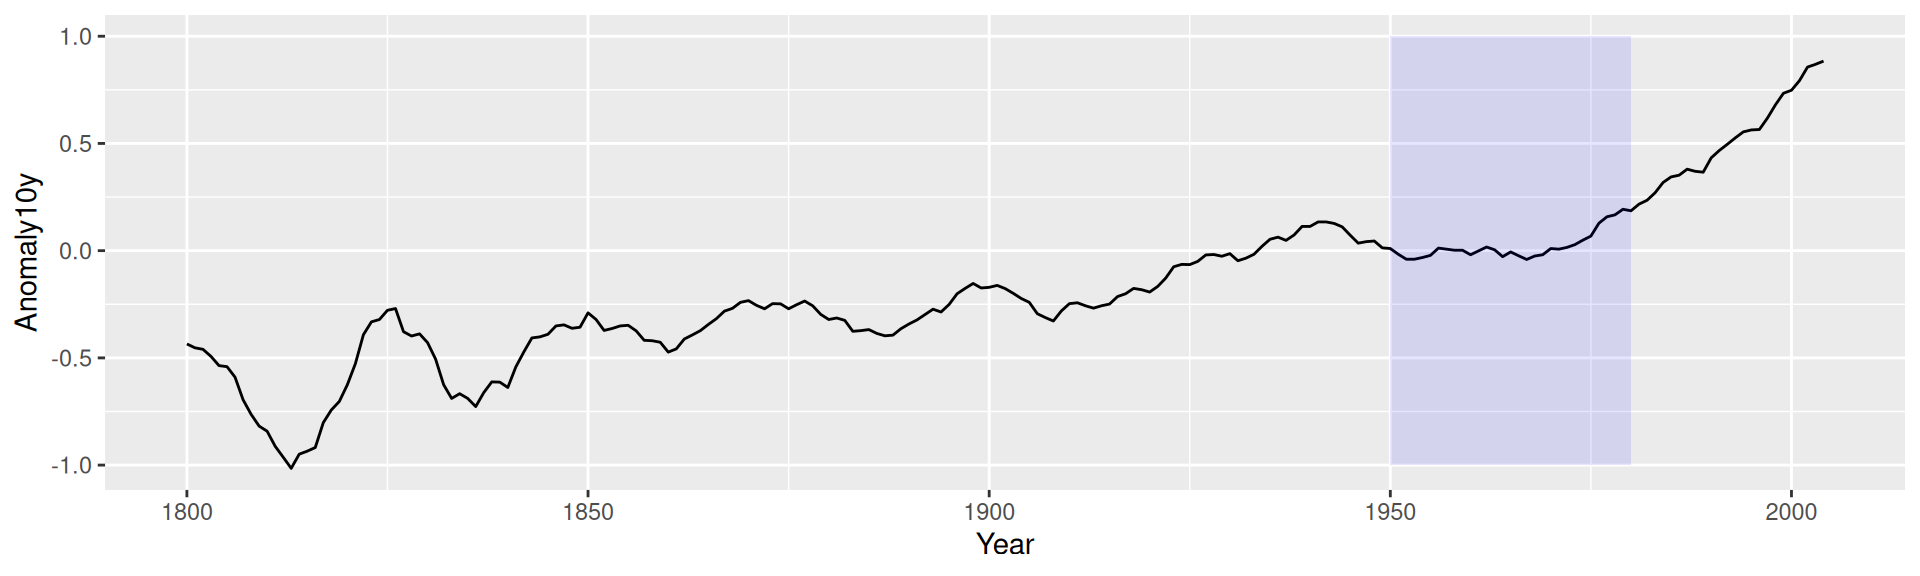
Figure 7.12: A shaded rectangle
7.5.3 Discussion
Each layer is drawn in the order that it’s added to the ggplot object, so in the preceding example, the rectangle is drawn on top of the line. It’s not a problem in that case, but if you’d like to have the line above the rectangle, add the rectangle first, and then the line.
Any geom can be used with annotate(), as long as you pass in the proper parameters. In this case, geom_rect() requires min and max values for x and y.