13.17 Creating a Map
13.17.2 Solution
Retrieve map data from the maps package and draw it with geom_polygon() (which can have a color fill) or geom_path() (which can’t have a fill). By default, the latitude and longitude will be drawn on a Cartesian coordinate plane, but you can use coord_map() and specify a projection. The default projection is “mercator”, which, unlike the Cartesian plane, has a progressively changing spacing for latitude lines (Figure 13.32):
library(maps) # For map data
# Get map data for USA
states_map <- map_data("state") # ggplot2 must be loaded to use map_data()

ggplot(states_map, aes(x = long, y = lat, group = group)) +
  geom_polygon(fill = "white", colour = "black")

# geom_path (no fill) and Mercator projection
ggplot(states_map, aes(x = long, y = lat, group = group)) +
  geom_path() + coord_map("mercator")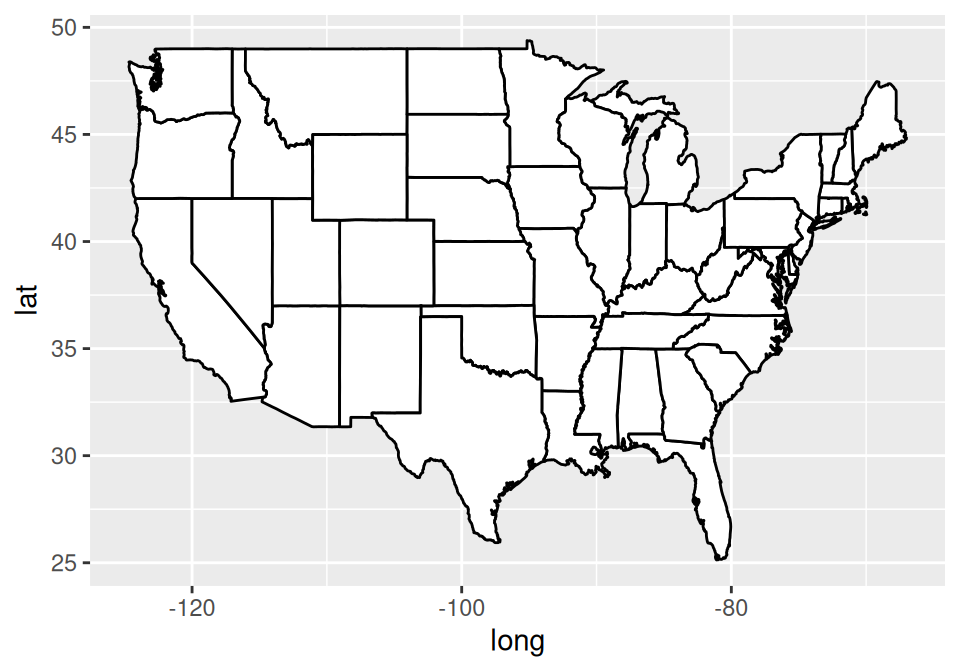
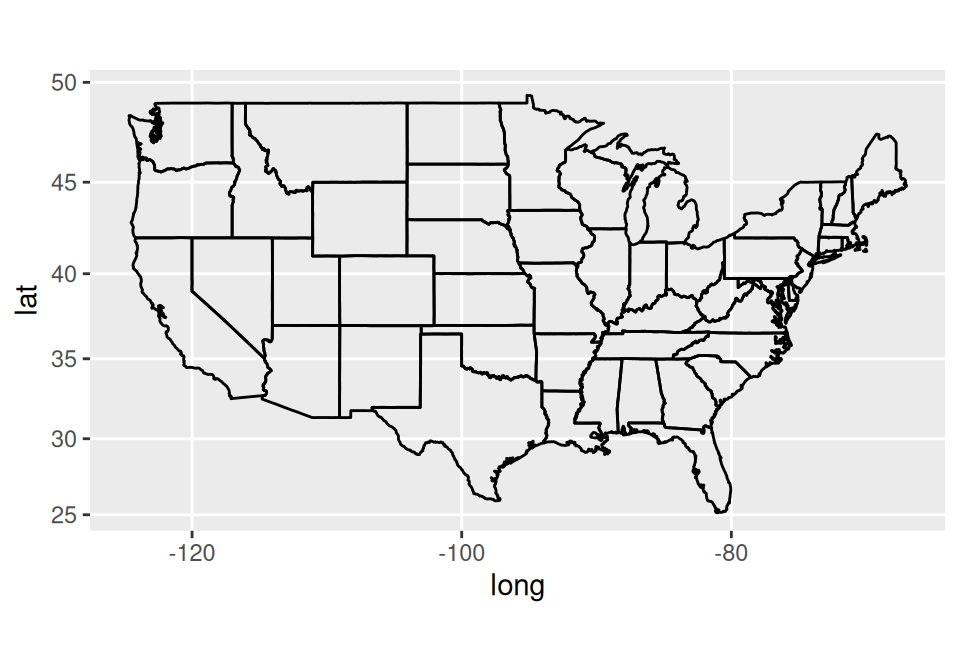
Figure 13.32: Top: a basic map with fill; bottom: with no fill, and Mercator projection
13.17.3 Discussion
The map_data() function returns a data frame with the following columns:
- long: Longitude.
- lat: Latitude.
- group: This is a grouping variable for each polygon. A region or subregion might have multiple polygons, for example, if it includes islands.
- order: The order to connect each point within a group.
- region: Roughly, the names of countries, although some other objects are present (such as some lakes).
- subregion: The names of subregions within a region, which can contain multiple groups. For example, the Alaska subregion includes many islands, each with its own group.
There are a number of different maps available, including world, nz, france, italy, usa (outline of the United States), state (each state in the USA), and county (each county in the USA). For example, to get map data for the world:
# Get map data for world
world_map <- map_data("world")
world_map
#>            long      lat group  order  region subregion
#> 1     -69.89912 12.45200     1      1   Aruba      <NA>
#> 2     -69.89571 12.42300     1      2   Aruba      <NA>
#> 3     -69.94219 12.43853     1      3   Aruba      <NA>
#>  ...<99,332 more rows>...
#> 99336  12.42754 41.90073  1627 100962 Vatican   enclave
#> 99337  12.43057 41.89756  1627 100963 Vatican   enclave
#> 99338  12.43916 41.89839  1627 100964 Vatican   enclave
If you want to draw a map of a region in the world map for which there isn’t a separate map, you can first look for the region name, like so:
sort(unique(world_map$region))
#>   [1] "Afghanistan"
#>   [2] "Albania"
#>   [3] "Algeria"
#>  ...
#> [250] "Yemen"
#> [251] "Zambia"
#> [252] "Zimbabwe"
It’s possible to get data for specific regions from a particular map (Figure 13.33):
east_asia <- map_data("world", region = c("Japan", "China", "North Korea", "South Korea"))

# Map region to fill color
ggplot(east_asia, aes(x = long, y = lat, group = group, fill = region)) +
  geom_polygon(colour = "black") +
  scale_fill_brewer(palette = "Set2")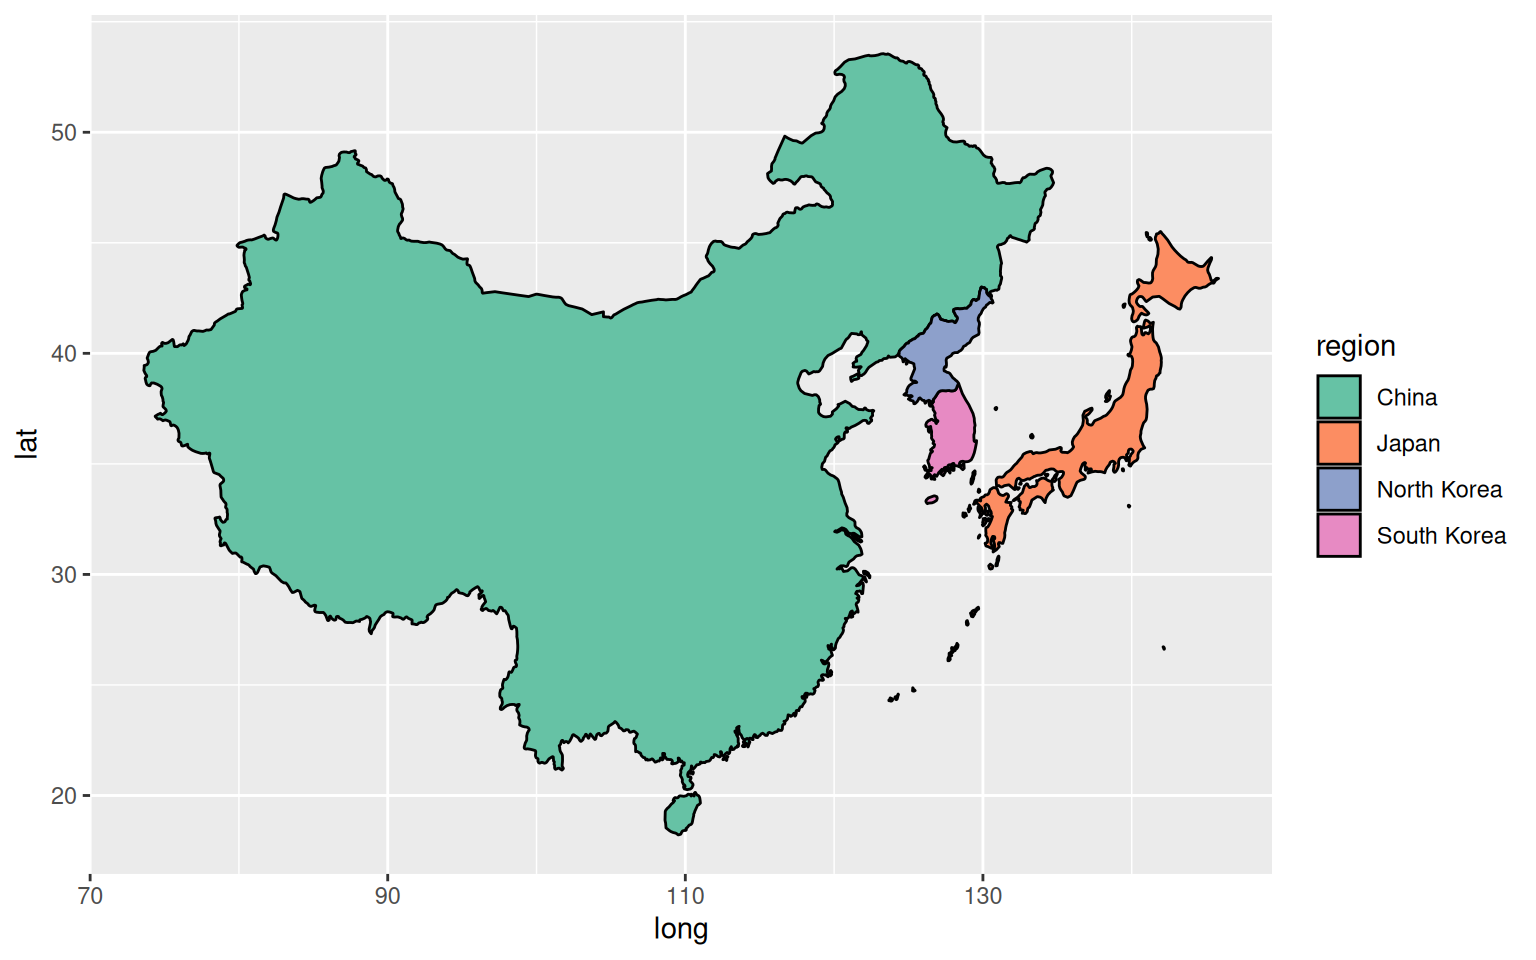
Figure 13.33: Specific regions from the world map
If there is a separate map available for a region, such as nz (New Zealand), that map data will be at a higher resolution than if you were to extract it from the world map, as shown in Figure 13.34:
# Get New Zealand data from world map
nz1 <- map_data("world", region = "New Zealand") %>%
  filter(long > 0 & lat > -48)        # Trim off islands

ggplot(nz1, aes(x = long, y = lat, group = group)) +
  geom_path()

# Get New Zealand data from the nz map
nz2 <- map_data("nz")
ggplot(nz2, aes(x = long, y = lat, group = group)) +
  geom_path()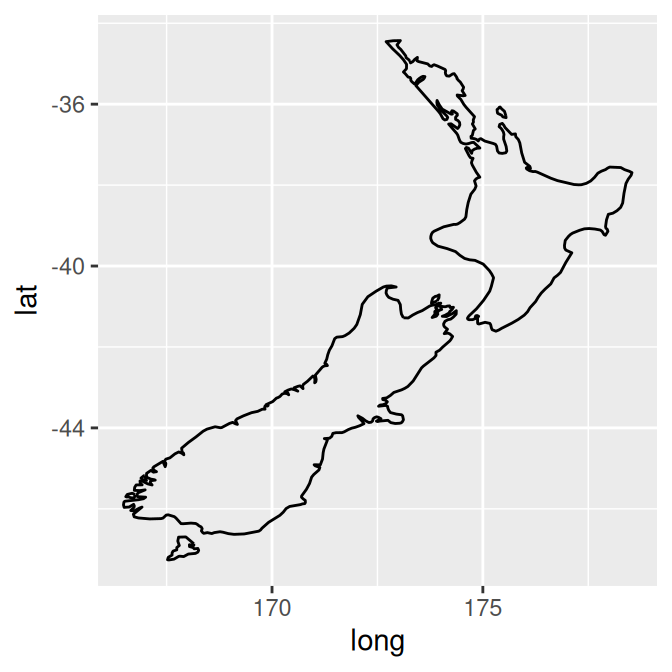
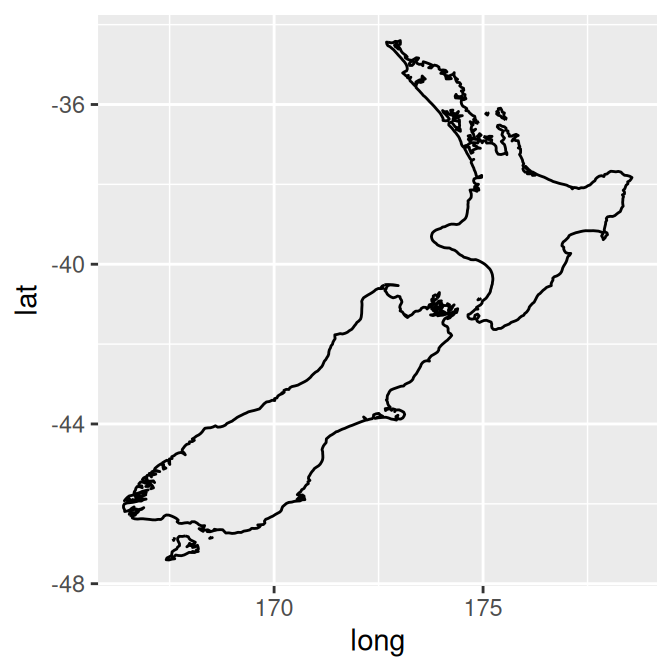
Figure 13.34: New Zealand data taken from world map (left); Data from nz map (right)