7.7 Adding Error Bars
7.7.2 Solution
Use geom_errorbar() and map variables to the values for ymin and ymax. Adding the error bars is done the same way for bar graphs and line graphs, as shown in Figure 7.14 (notice that default y range is different for bars and lines, though):
library(gcookbook) # Load gcookbook for the cabbage_exp data set
library(dplyr)

# Take a subset of the cabbage_exp data for this example
ce_mod <- cabbage_exp %>%
  filter(Cultivar == "c39")

# With a bar graph
ggplot(ce_mod, aes(x = Date, y = Weight)) +
  geom_col(fill = "white", colour = "black") +
  geom_errorbar(aes(ymin = Weight - se, ymax = Weight + se), width = .2)

# With a line graph
ggplot(ce_mod, aes(x = Date, y = Weight)) +
  geom_line(aes(group = 1)) +
  geom_point(size = 4) +
  geom_errorbar(aes(ymin = Weight - se, ymax = Weight + se), width = .2)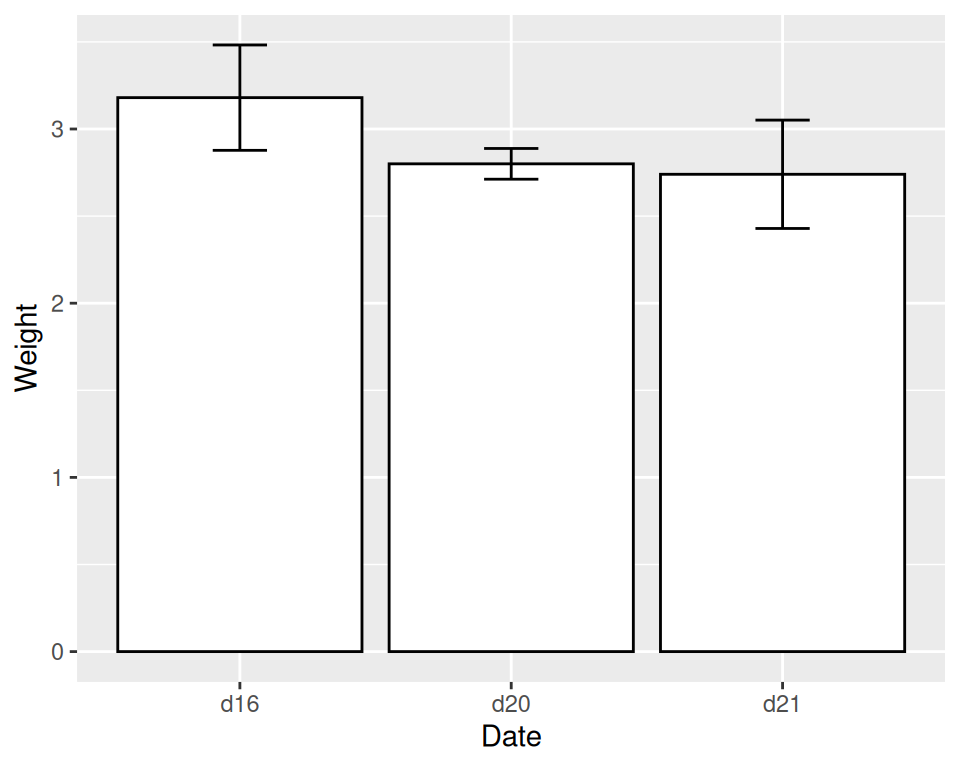
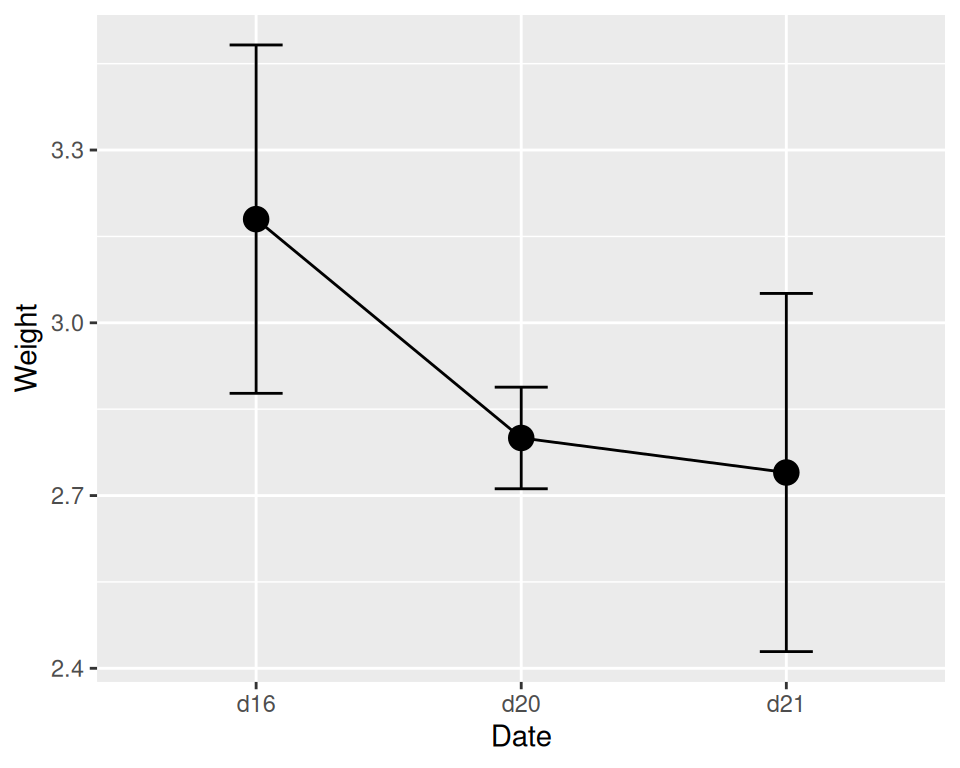
Figure 7.14: error bars on a bar graph (left); on a line graph (right)
7.7.3 Discussion
In this example, the data already has values for the standard error of the mean (se), which we’ll use for the error bars (it also has values for the standard deviation, sd, but we’re not using that here):
ce_mod
#>   Cultivar Date Weight        sd  n         se
#> 1      c39  d16   3.18 0.9566144 10 0.30250803
#> 2      c39  d20   2.80 0.2788867 10 0.08819171
#> 3      c39  d21   2.74 0.9834181 10 0.31098410
To get the values for ymax and ymin, we took the y variable, Weight, and added/subtracted se.
We also specified the width of the ends of the error bars, with width = .2. It’s best to play around with this to find a value that looks good. If you don’t set the width, the error bars will be very wide, spanning all the space between items on the x-axis.
For a bar graph with groups of bars, the error bars must also be dodged; otherwise, they’ll have the exact same x coordinate and won’t line up with the bars. (See Recipe 3.2 for more information about grouped bars and dodging.)
We’ll work with the full cabbage_exp data set this time:
cabbage_exp
#>   Cultivar Date Weight        sd  n         se
#> 1      c39  d16   3.18 0.9566144 10 0.30250803
#> 2      c39  d20   2.80 0.2788867 10 0.08819171
#> 3      c39  d21   2.74 0.9834181 10 0.31098410
#> 4      c52  d16   2.26 0.4452215 10 0.14079141
#> 5      c52  d20   3.11 0.7908505 10 0.25008887
#> 6      c52  d21   1.47 0.2110819 10 0.06674995
The default dodge width for geom_bar() is 0.9, and you’ll have to tell the error bars to be dodged the same width. If you don’t specify the dodge width, it will default to dodging by the width of the error bars, which is usually less than the width of the bars (Figure 7.15):
# Bad: dodge width not specified
ggplot(cabbage_exp, aes(x = Date, y = Weight, fill = Cultivar)) +
  geom_col(position = "dodge") +
  geom_errorbar(aes(ymin = Weight - se, ymax = Weight + se),
                position = "dodge", width = .2)

# Good: dodge width set to same as bar width (0.9)
ggplot(cabbage_exp, aes(x = Date, y = Weight, fill = Cultivar)) +
  geom_col(position = "dodge") +
  geom_errorbar(aes(ymin = Weight - se, ymax = Weight + se),
                position = position_dodge(0.9), width = .2)
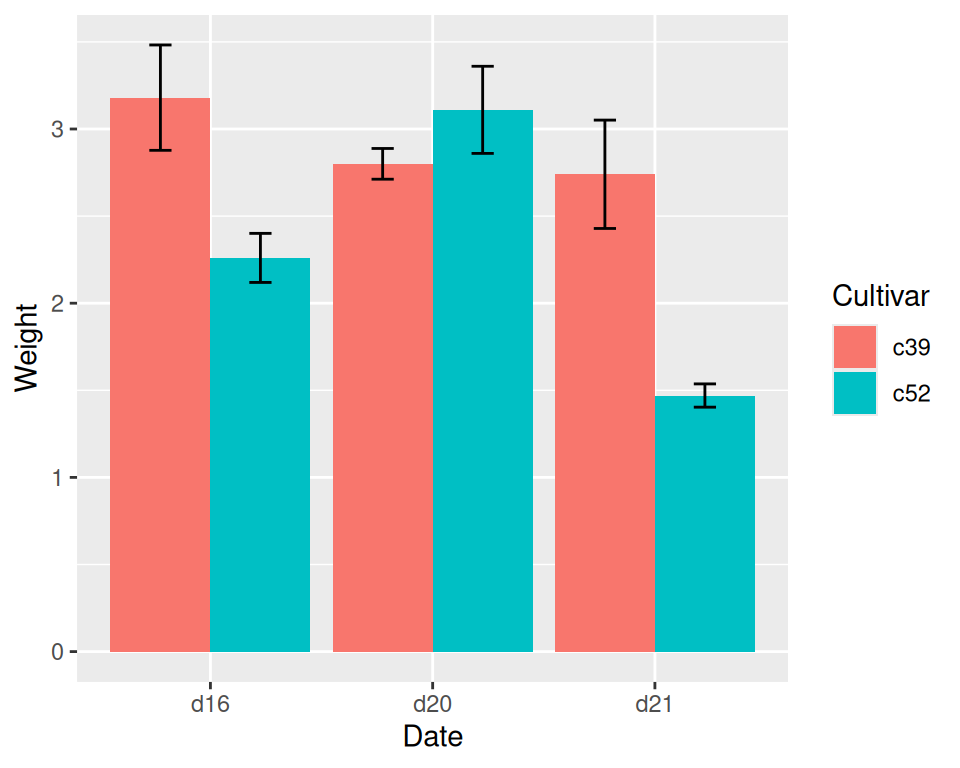
Figure 7.15: error bars on a grouped bar graph without dodging width specified (left); with dodging width specified (right)
Note
Notice that we used
position = "dodge", which is shorthand forposition = position_dodge(), in the first version. But to pass a specific value, we have to spell it out, as inposition_dodge(0.9).
For line graphs, if the error bars are a different color than the lines and points, you should draw the error bars first, so that they are underneath the points and lines. Otherwise the error bars will be drawn on top of the points and lines, which won’t look right.
Additionally, you should dodge all the geometric elements so that they will align with the error bars, as shown in Figure 7.16:
pd <- position_dodge(.3)  # Save the dodge spec because we use it repeatedly

ggplot(cabbage_exp, aes(x = Date, y = Weight, colour = Cultivar, group = Cultivar)) +
  geom_errorbar(
    aes(ymin = Weight - se, ymax = Weight + se),
    width = .2,
    size = 0.25,
    colour = "black",
    position = pd
  ) +
  geom_line(position = pd) +
  geom_point(position = pd, size = 2.5)

# Thinner error bar lines with size = 0.25, and larger points with size = 2.5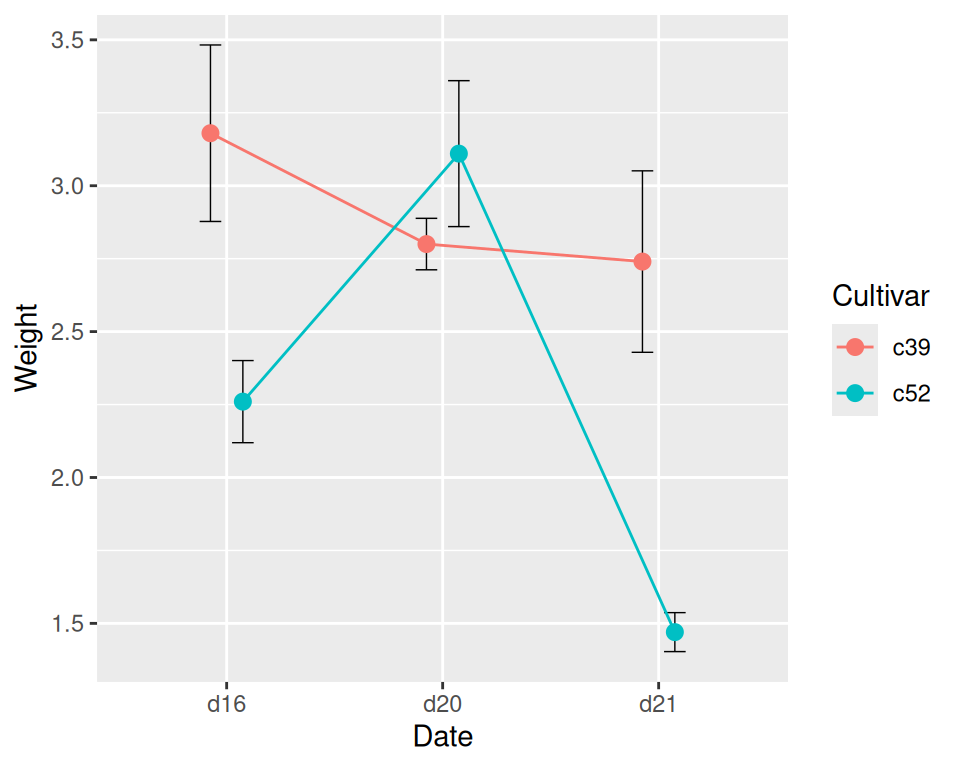
Figure 7.16: Error bars on a line graph, dodged so they don’t overlap
Notice that we set colour = "black" to make the error bars black; otherwise, they would inherit colour. We also made sure the Cultivar was used as a grouping variable by mapping it to group.
When a discrete variable is mapped to an aesthetic like colour or fill (as in the case of the bars), that variable is used for grouping the data. But by setting the colour of the error bars, we made it so that the variable for colour was not used for grouping, and we needed some other way to inform ggplot that the two data entries at each x were in different groups so that they would be dodged.
7.7.4 See Also
See Recipe 3.2 for more about creating grouped bar graphs, and Recipe 4.3 for more about creating line graphs with multiple lines.
See Recipe 15.18 for calculating summaries with means, standard deviations, standard errors, and confidence intervals.
See Recipe 4.9 for adding a confidence region when the data has a higher density along the x-axis.