14.5 Outputting to Bitmap (PNG/TIFF) Files
14.5.2 Solution
There are two ways to output to PNG bitmap files. One method is to open the PNG graphics device with png(), make the plots, then close the device with dev.off(). This method works for most graphics in R, including base graphics and grid-based graphics like those created by ggplot2 and lattice:
# width and height are in pixels
png("myplot.png", width = 400, height = 400)

# Make plot
plot(mtcars$wt, mtcars$mpg)

dev.off()
For outputting multiple plots, put %d in the filename. This will be replaced with 1, 2, 3, and so on, for each subsequent plot:
# width and height are in pixels
png("myplot-%d.png", width = 400, height = 400)

plot(mtcars$wt, mtcars$mpg)
print(ggplot(mtcars, aes(x = wt, y = mpg)) + geom_point())

dev.off()
Notice that we called print() on the ggplot object to make sure that it will be output even when this code is in a script.
The width and height are in pixels, and the default is to output at 72 pixels per inch (ppi). This resolution is suitable for displaying on a screen, but will look pixelated and jagged in print.
For high-quality print output, use at least 300 ppi. Figure 14.2 shows portions of the same plot at different resolutions. In this example, we’ll use 300 ppi and create a 4×4-inch PNG file:
ppi <- 300
# Calculate the height and width (in pixels) for a 4x4-inch image at 300 ppi
png("myplot.png", width = 4*ppi, height = 4*ppi, res = ppi)
plot(mtcars$wt, mtcars$mpg)
dev.off()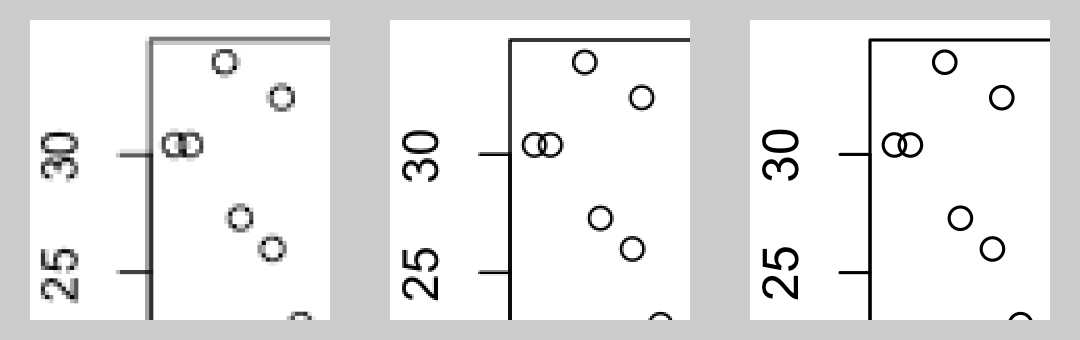
Figure 14.2: From left to right: PNG output at 72, 150, and 300 ppi (actual size)
If you are creating plots from a script and it throws an error while creating one, R might not reach the call to dev.off(), and could be left in a state where the PNG device is still open. When this happens, the PNG file won’t open properly in a viewing program until you manually call dev.off().
If you are creating a plot with ggplot, using ggsave() can be a little simpler. It simply saves the last plot created with ggplot(). You specify the width and height in inches, not pixels, and tell it how many pixels per inch to use:
ggplot(mtcars, aes(x = wt, y = mpg)) + geom_point()

# Default dimensions are in inches, but you can specify the unit
ggsave("myplot.png", width = 8, height = 8, unit = "cm", dpi = 300)
With ggsave(), you don’t need to print the ggplot object, and if there is an error while creating or saving the plot there’s no need to manually close the graphic device.
Note
Although the argument name is
dpi, it really controls the pixels per inch (ppi), not the dots per inch. When a grey pixel is rendered in print, it is output with many smaller dots of black ink-and so print output has more dots per inch than pixels per inch.
14.5.3 Discussion
R supports other bitmap formats, like BMP, TIFF, and JPEG, but there’s really not much reason to use them instead of PNG.
The exact appearance of the resulting bitmaps varies from platform to platform. Unlike R’s PDF output device, which renders consistently across platforms, the bitmap output devices may render the same plot differently on Windows, Linux, and Mac OS X. There can even be variation within each of these operating systems.
Different platforms will render fonts differently, some platforms will antialias (smooth) lines while others will not, and some platforms support alpha (transparency) while others do not. If your platform lacks support for features like antialiasing and alpha, you can use CairoPNG(), from the Cairo package:
While CairoPNG() does not guarantee identical rendering across platforms (fonts may not be exactly the same), it does support features like antialiasing and alpha.
Changing the resolution affects the size (in pixels) of graphical objects like text, lines, and points. For example, a 6-by-6-inch image at 75 ppi has the same pixel dimensions as a 3-by-3-inch image at 150 ppi, but the appearance will be different, as shown in Figure 14.3. Both of these images are 450×450 pixels. When displayed on a computer screen, they may display at approximately the same size, as they do here.
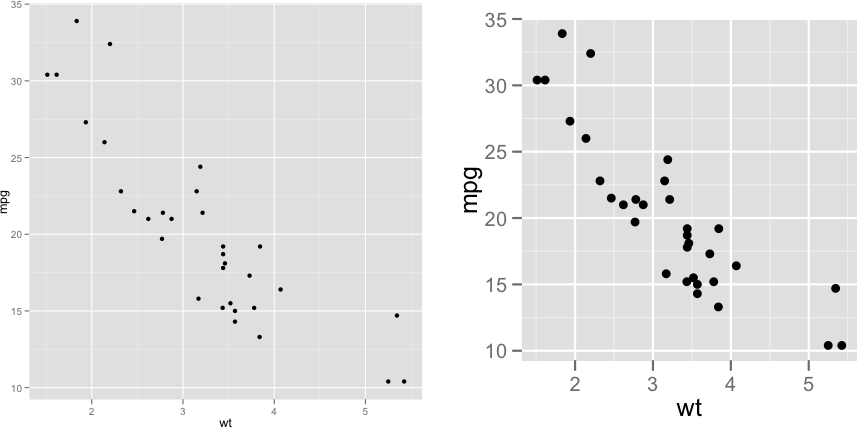
Figure 14.3: 6×6 inch image at 75 ppi (left); 3×3 inch image at 150 ppi (right)