10.10 Using Labels with Multiple Lines of Text
10.10.2 Solution
Set the labels in the scale, using \n to represent a newline. In this example, we’ll use scale_fill_discrete() to control the legend for the fill scale (Figure 10.17, left):
10.10.3 Discussion
As you can see in the version on the left in Figure 10.17, with the default settings the lines of text will run into each other when you use labels that have more than one line. To deal with this problem, you can increase the height of the legend keys and decrease the spacing between lines, using theme() (Figure 10.17, right). To do this, you will need to specify the height using the unit() function from the grid package:
library(grid)

pg_plot +
  scale_fill_discrete(labels = c("Control", "Type 1\ntreatment", "Type 2\ntreatment")) +
  theme(legend.text = element_text(lineheight = .8), legend.key.height = unit(1, "cm"))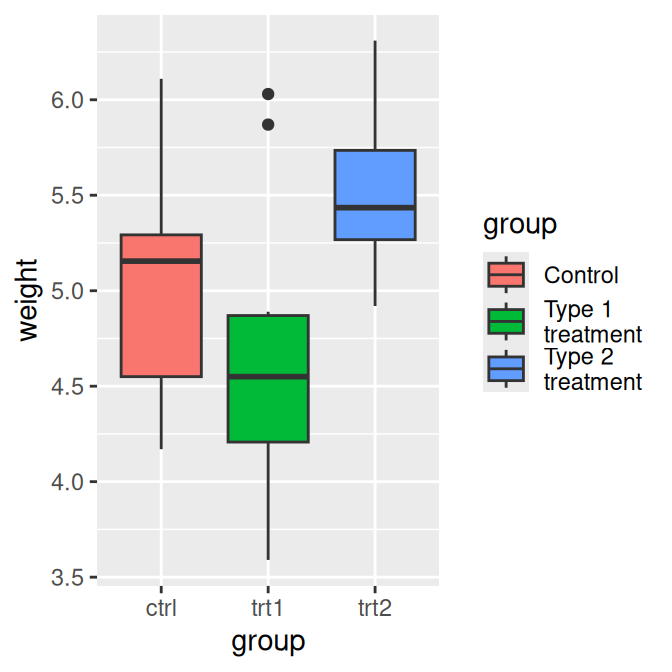
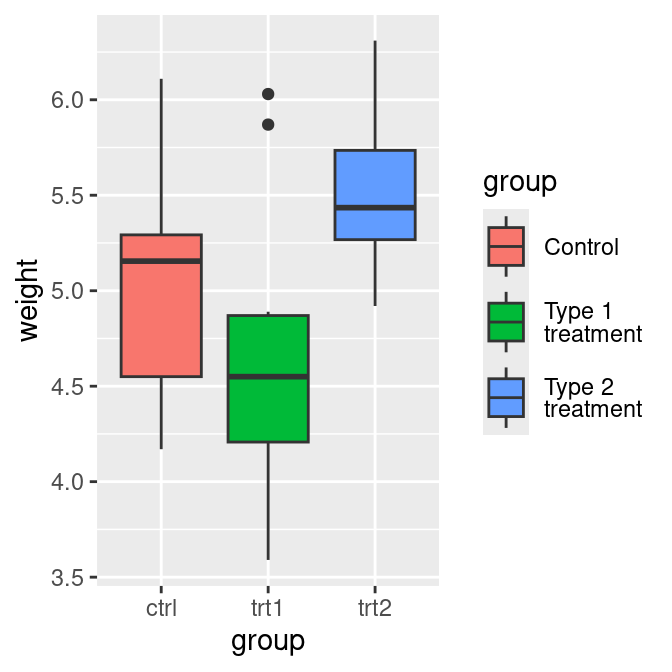
Figure 10.17: Multiline legend labels (left); With increased key height and reduced line spacing (right)