15.9 Changing the Order of Factor Levels Based on Data Values
15.9.2 Solution
Use reorder() with the factor that has levels to reorder, the values to base the reordering on, and a function that aggregates the values:
# Make a copy of the InsectSprays data set since we're modifying it
iss <- InsectSprays
iss$spray
#>  [1] A A A A A A A A A A A A B B B B B B B B B B B B C C C C C C C C C C C C
#> [37] D D D D D D D D D D D D E E E E E E E E E E E E F F F F F F F F F F F F
#> Levels: A B C D E F

iss$spray <- reorder(iss$spray, iss$count, FUN = mean)
iss$spray
#>  [1] A A A A A A A A A A A A B B B B B B B B B B B B C C C C C C C C C C C C
#> [37] D D D D D D D D D D D D E E E E E E E E E E E E F F F F F F F F F F F F
#> attr(,"scores")
#>         A         B         C         D         E         F
#> 14.500000 15.333333  2.083333  4.916667  3.500000 16.666667
#> Levels: C E D A B F
Notice that the original levels were ABCDEF, while the reordered levels are CEDABF. What we’ve done is reorder the levels of spray based on the mean value of count for each level of spray.
15.9.3 Discussion
The usefulness of reorder() might not be obvious from just looking at the raw output. Figure 15.1 shows three plots made with reorder(). In these plots, the order in which the items appear is determined by their values.
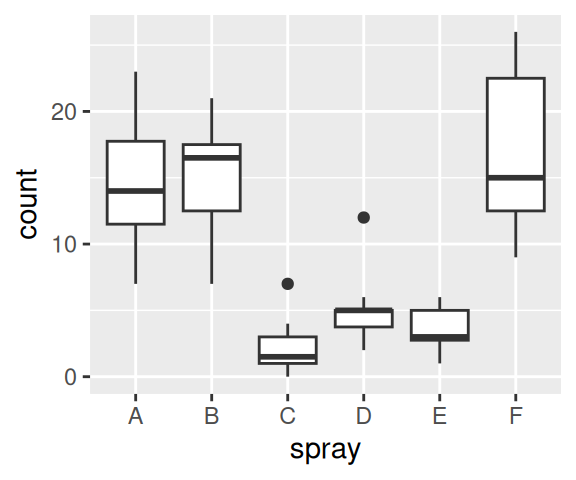
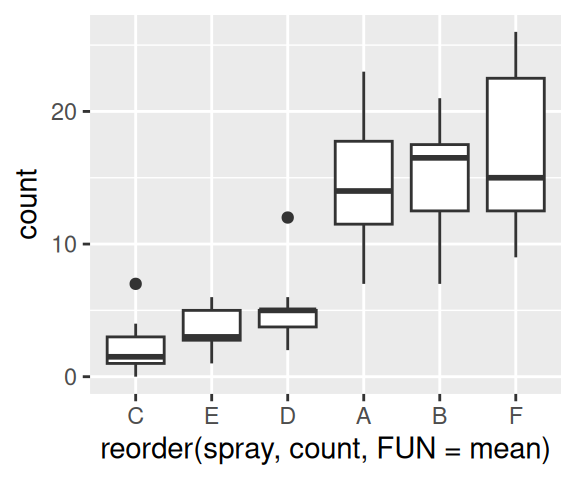
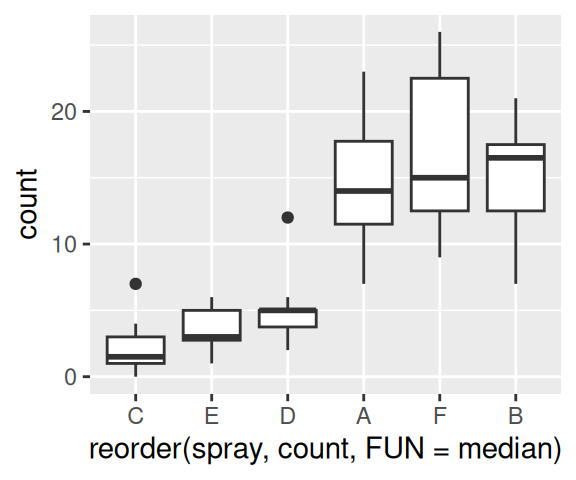
Figure 15.1: Original data (left); Reordered by the mean of each group (middle); Reordered by the median of each group (right)
In the middle plot in Figure 15.1, the boxes are sorted by the mean. The horizontal line that runs across each box represents the median of the data. Notice that these values do not increase strictly from left to right. That’s because with this particular data set, sorting by the mean gives a different order than sorting by the median. To make the median lines increase from left to right, as in the plot on the right in Figure 15.1, we used the median() function in reorder().
The tidyverse function for reordering factors is fct_reorder(), and it is used the same way as reorder(). These do the same thing: