8.6 Setting the Positions of Tick Marks
8.6.2 Solution
Usually ggplot does a good job of deciding where to put the tick marks, but if you want to change them, set breaks in the scale (Figure 8.12):
ggplot(PlantGrowth, aes(x = group, y = weight)) +
  geom_boxplot()

ggplot(PlantGrowth, aes(x = group, y = weight)) +
  geom_boxplot() +
  scale_y_continuous(breaks = c(4, 4.25, 4.5, 5, 6, 8))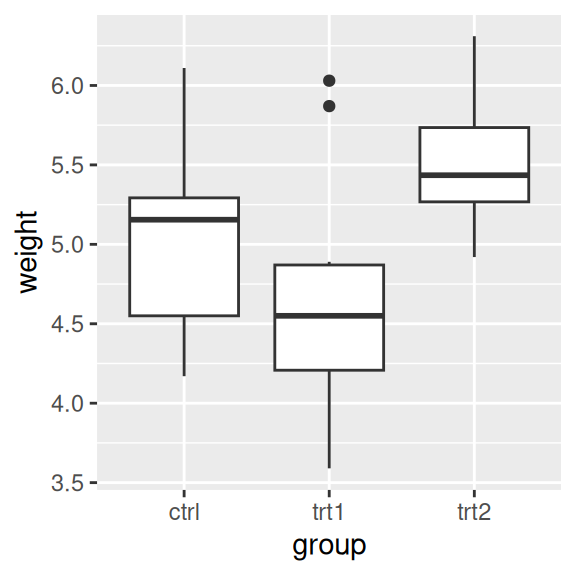
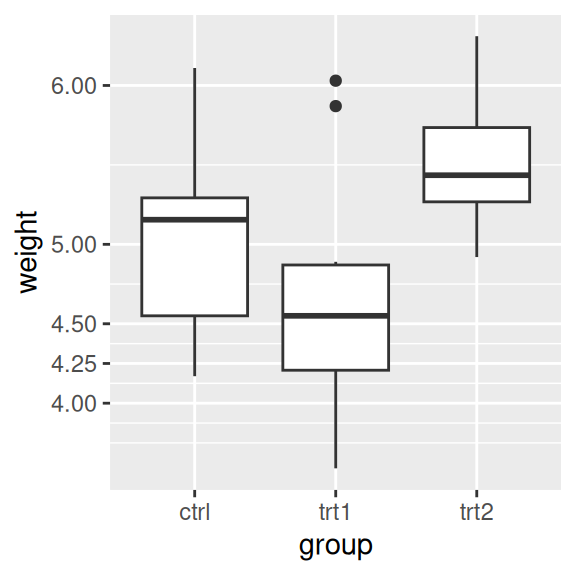
Figure 8.12: Box plot with automatic tick marks (left); With manually set tick marks (right)
8.6.3 Discussion
The location of the tick marks defines where major grid lines are drawn. If the axis represents a continuous variable, minor grid lines, which are fainter and unlabeled, will by default be drawn halfway between each major grid line.
You can also use the seq() function or the : operator to generate vectors for tick marks:
If the axis is discrete instead of continuous, then there is by default a tick mark for each item. For discrete axes, you can change the order of items or remove them by specifying the limits (see Recipe 8.4). Setting breaks will change which of the levels are labeled, but will not remove them or change their order. Figure 8.13 shows what happens when you set limits and breaks (the warning is because we’re using only two of the three levels for group and therefore are dropping some rows):
# Set both breaks and labels for a discrete axis
ggplot(PlantGrowth, aes(x = group, y = weight)) +
  geom_boxplot() +
  scale_x_discrete(limits = c("trt2", "ctrl"), breaks = "ctrl")
#> Warning: Removed 10 rows containing missing values or values outside the scale range
#> (`stat_boxplot()`).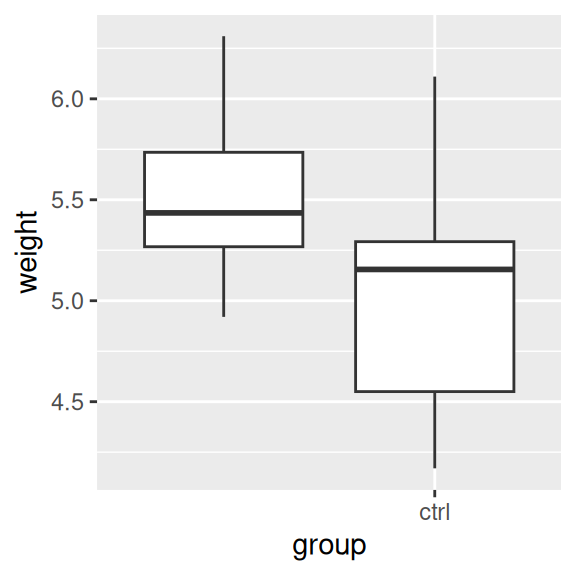
Figure 8.13: For a discrete axis, setting limits reorders and removes items, and setting breaks controls which items have labels
8.6.4 See Also
To remove the tick marks and labels (but not the data) from thegraph, see Recipe 8.7.