8.4 Changing the Order of Items on a Categorical Axis
8.4.2 Solution
For a categorical (or discrete) axis – one with a factor mapped to it – the order of items can be changed by setting limits in scale_x_discrete() or scale_y_discrete().
To manually set the order of items on the axis, specify limits with a vector of the levels in the desired order. You can also omit items with this vector, as shown in Figure 8.8, left:
8.4.3 Discussion
You can also use this method to display a subset of the items on the axis. This will show only ctrl and trt1 (Figure 8.8, right). Note that because data is removed, it will emit a warning when you do this.
pg_plot +
  scale_x_discrete(limits = c("ctrl", "trt1"))
#> Warning: Removed 10 rows containing missing values (stat_boxplot).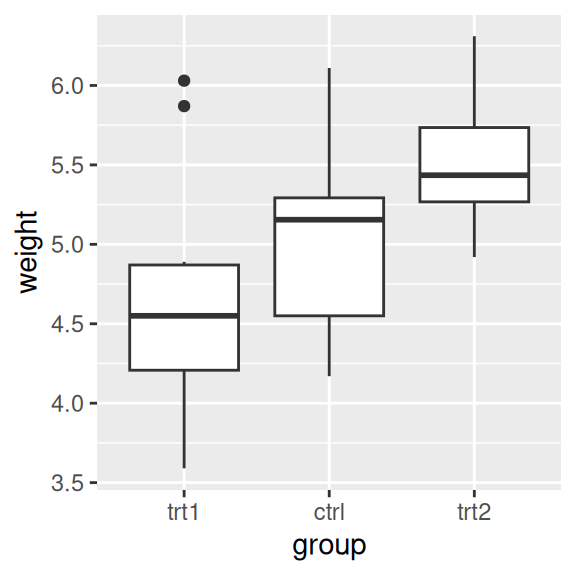
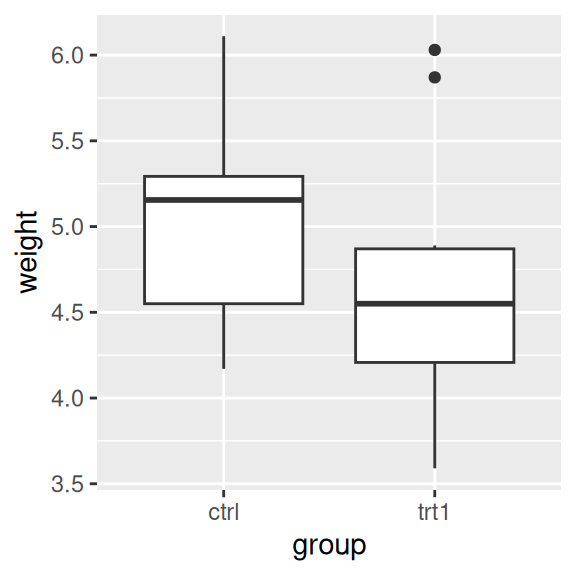
Figure 8.8: Box plot with manually specified items on the x-axis (left); With only two items (right)
To reverse the order, set limits = rev(levels(...)), and put the factor inside. This will reverse the order of the PlantGrowth$group factor, as shown in Figure 8.9:
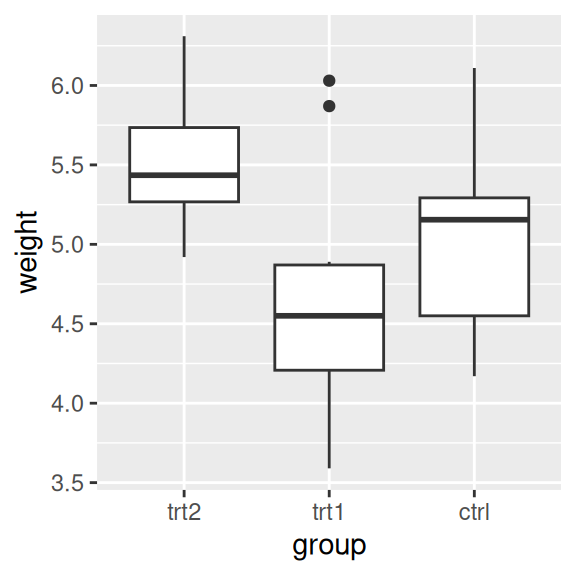
Figure 8.9: Box plot with order reversed on the x-axis
8.4.4 See Also
To reorder factor levels based on data values from another column, see Recipe 15.9.