13.5 Using Text Labels in a Network Graph
13.5.2 Solution
The vertices/nodes may have names, but these names are not used as labels by default. To set the labels, pass in a vector of names to vertex.label (Figure 13.10):
library(igraph)
library(gcookbook) # For the data set

# Copy madmen and drop every other row
m <- madmen[1:nrow(madmen) %% 2 == 1, ]

g <- graph.data.frame(m, directed=FALSE) # Print out the names of each vertex

V(g)$name
#>  [1] "Betty Draper"      "Don Draper"        "Harry Crane"
#>  [4] "Joan Holloway"     "Lane Pryce"        "Peggy Olson"
#>  [7] "Pete Campbell"     "Roger Sterling"    "Sal Romano"
#>  ...
#> [19] "Rebecca Pryce"     "Abe Drexler"       "Duck Phillips"
#> [22] "Playtex bra model" "Ida Blankenship"   "Mirabelle Ames"
#> [25] "Vicky"             "Kitty Romano"

plot(g, layout=layout.fruchterman.reingold,
    vertex.size = 4,          # Smaller nodes
    vertex.label = V(g)$name, # Set the labels
    vertex.label.cex = 0.8,   # Slightly smaller font
    vertex.label.dist = 0.4,  # Offset the labels
    vertex.label.color = "black")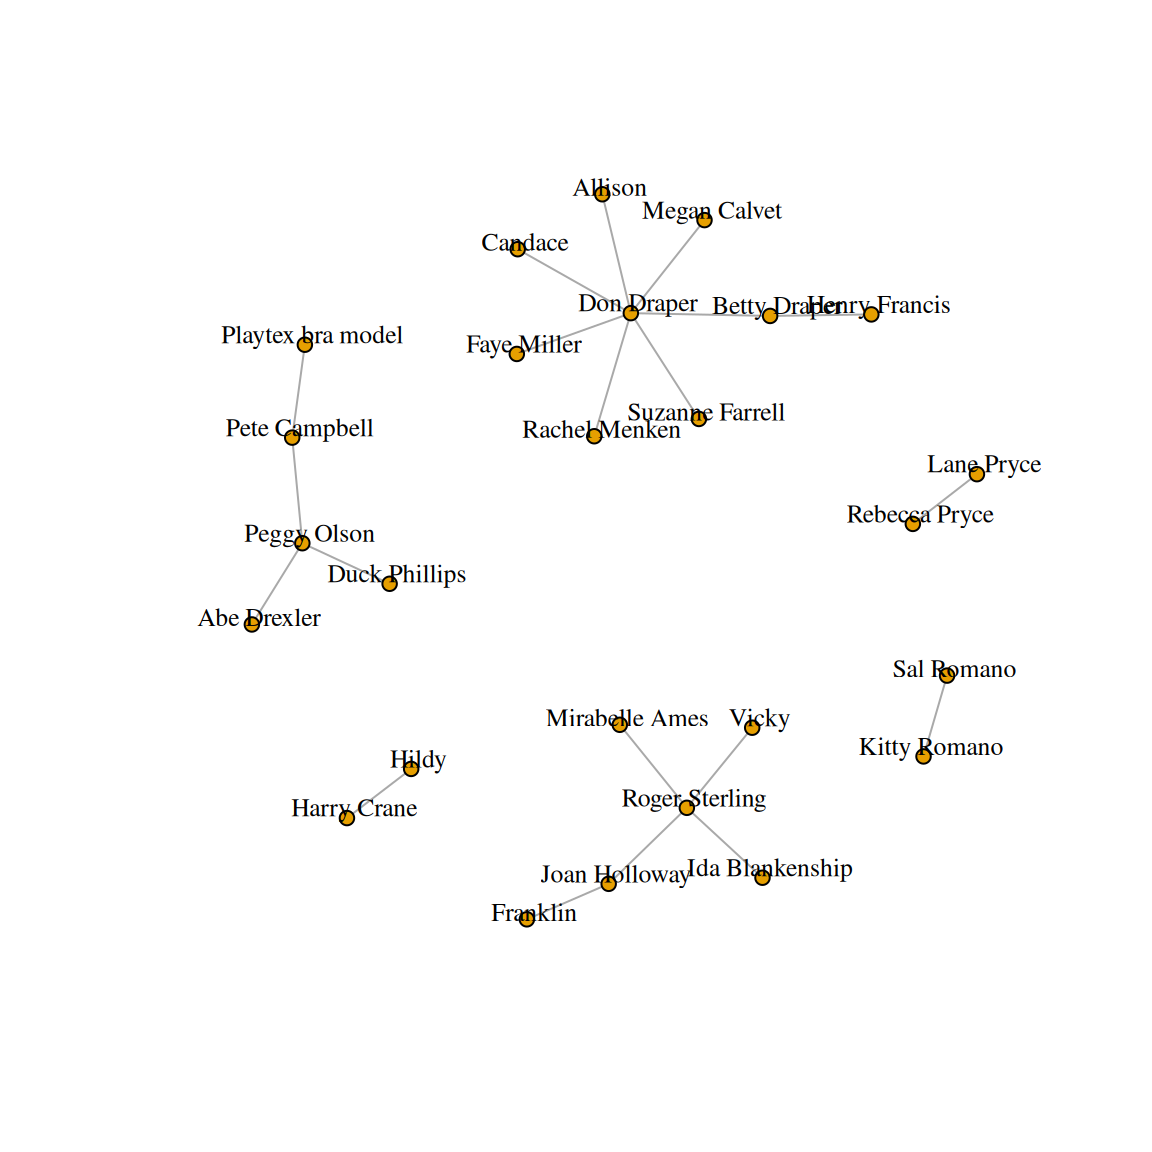
Figure 13.10: A network graph with labels
13.5.3 Discussion
Another way to achieve the same effect is to modify the plot object, instead of passing in the values as arguments to plot(). To do this, use V()$xxx<- instead of passing a value to a vertex.xxx argument. For example, this will result in the same output as the previous code:
# This is equivalent to the preceding code
V(g)$size        <- 4
V(g)$label       <- V(g)$name
V(g)$label.cex   <- 0.8
V(g)$label.dist  <- 0.4
V(g)$label.color <- "black"

# Set a property of the entire graph
g$layout <- layout.fruchterman.reingold

plot(g)
The properties of the edges can also be set, either with the E() function or by passing values to edge.xxx arguments (Figure 13.11):
# View the edges
E(g)
#> + 20/20 edges from 837547d (vertex names):
#>  [1] Betty Draper  --Henry Francis     Don Draper    --Allison
#>  [3] Betty Draper  --Don Draper        Don Draper    --Candace
#>  [5] Don Draper    --Faye Miller       Don Draper    --Megan Calvet
#>  [7] Don Draper    --Rachel Menken     Don Draper    --Suzanne Farrell
#>  [9] Harry Crane   --Hildy             Joan Holloway --Franklin
#> [11] Joan Holloway --Roger Sterling    Lane Pryce    --Rebecca Pryce
#> [13] Peggy Olson   --Abe Drexler       Peggy Olson   --Duck Phillips
#> [15] Peggy Olson   --Pete Campbell     Pete Campbell --Playtex bra model
#> [17] Roger Sterling--Ida Blankenship   Roger Sterling--Mirabelle Ames
#> [19] Roger Sterling--Vicky             Sal Romano    --Kitty Romano

# Set some of the labels to "M"
E(g)[c(2,11,19)]$label <- "M"

# Set color of all to grey, and then color a few red
E(g)$color             <- "grey70"
E(g)[c(2,11,19)]$color <- "red"

plot(g)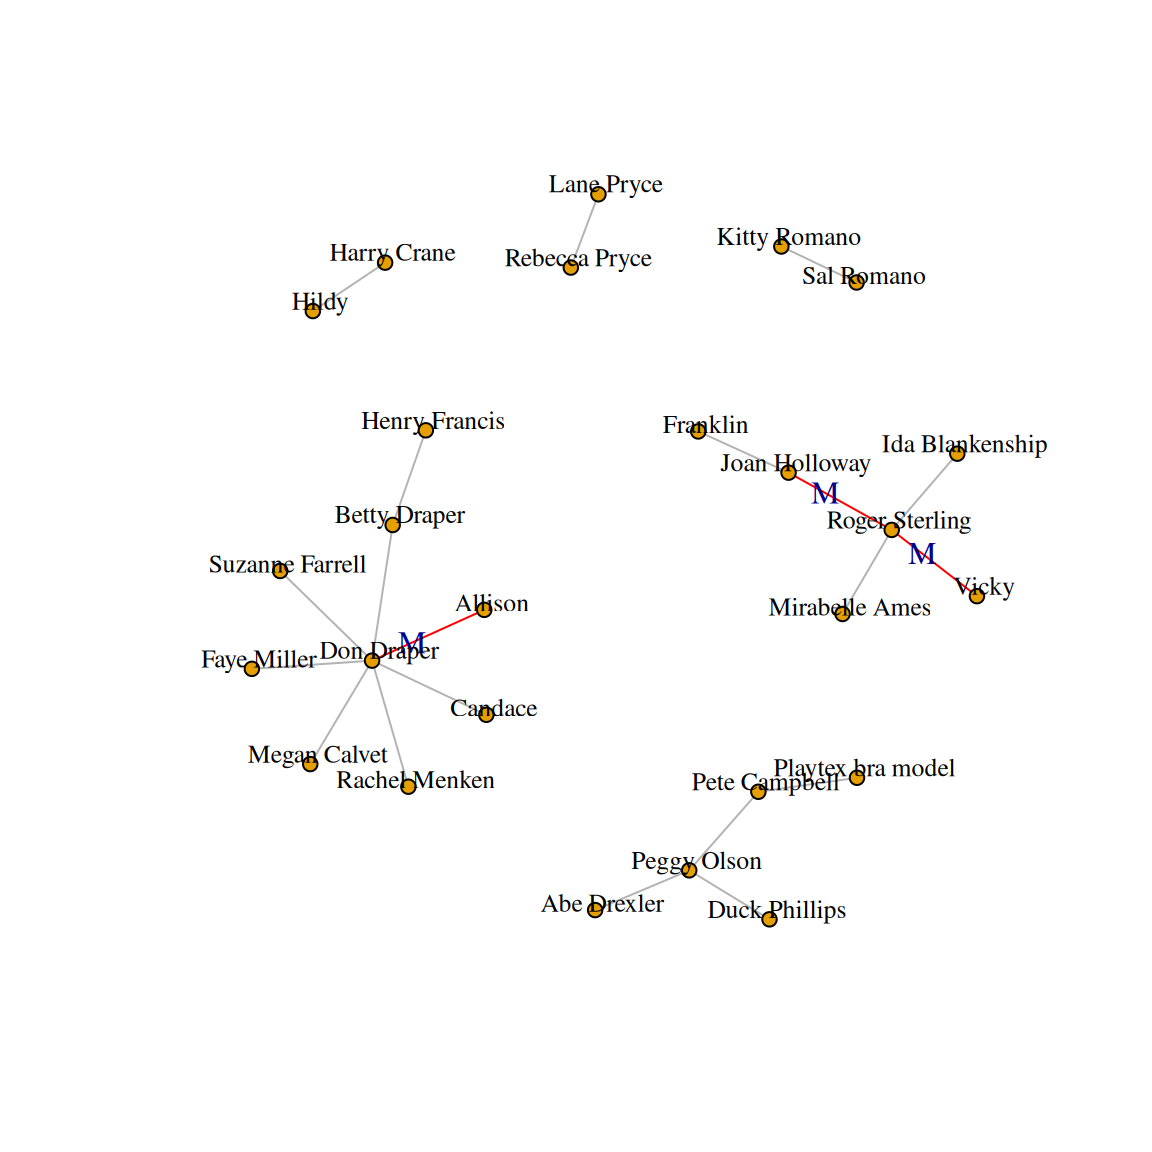
Figure 13.11: A network graph with labeled and colored edges