12.1 Setting the Colors of Objects
12.1.2 Solution
In the call to the geom, set the values of colour or fill (Figure 12.1):
library(MASS)  # Load MASS for the birthwt data set

ggplot(birthwt, aes(x = bwt)) +
  geom_histogram(fill = "red", colour = "black")

ggplot(mtcars, aes(x = wt, y = mpg)) +
  geom_point(colour = "red")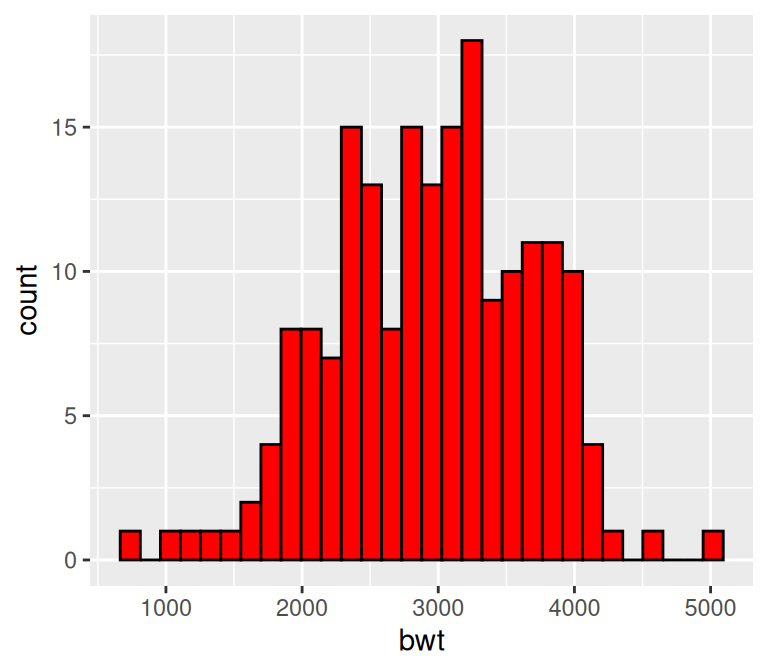
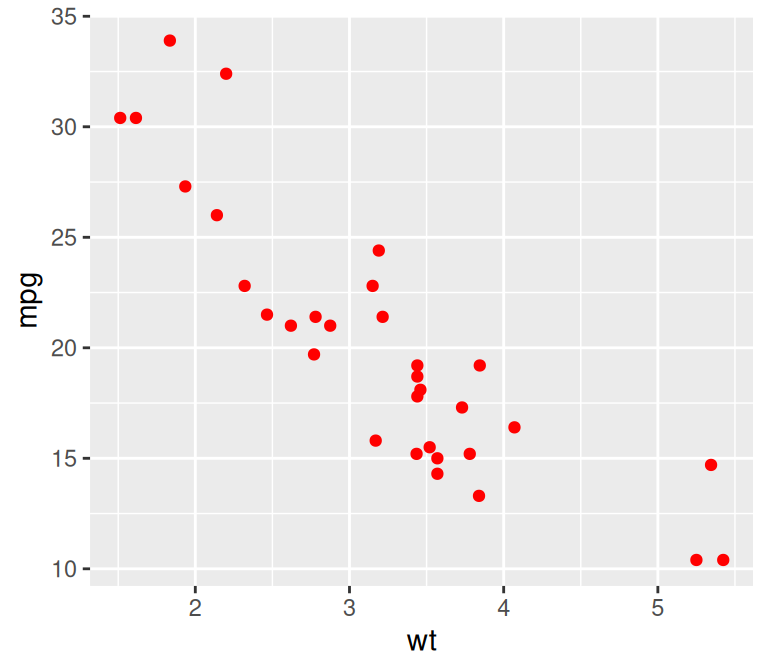
Figure 12.1: Setting fill and colour (left); Setting colour for points (right)
12.1.3 Discussion
In ggplot2, there’s an important difference between setting and mapping aesthetic properties. In the preceding example, we set the color of the objects to “red”.
Generally speaking, colour controls the color of lines and of the outlines of polygons, while fill controls the color of the fill area of polygons. However, point shapes are sometimes a little different. For most point shapes, the color of the entire point is controlled by colour, not fill. The exception is the point shapes (21–25) that have both a fill and an outline.
You can use colour or color interchangeably with ggplot2. In this book, I’ve used colour, in keeping with the form used in the official ggplot2 documentation.