13.14 Creating a Graph of an Empirical Cumulative Distribution Function
13.14.1 Problem
You want to graph the empirical cumulative distribution function (ECDF) of a data set.
13.14.2 Solution
Use stat_ecdf() (Figure 13.26):
library(gcookbook) # For the data set

# ecdf of heightIn
ggplot(heightweight, aes(x = heightIn)) +
  stat_ecdf()

# ecdf of ageYear
ggplot(heightweight, aes(x = ageYear)) +
  stat_ecdf()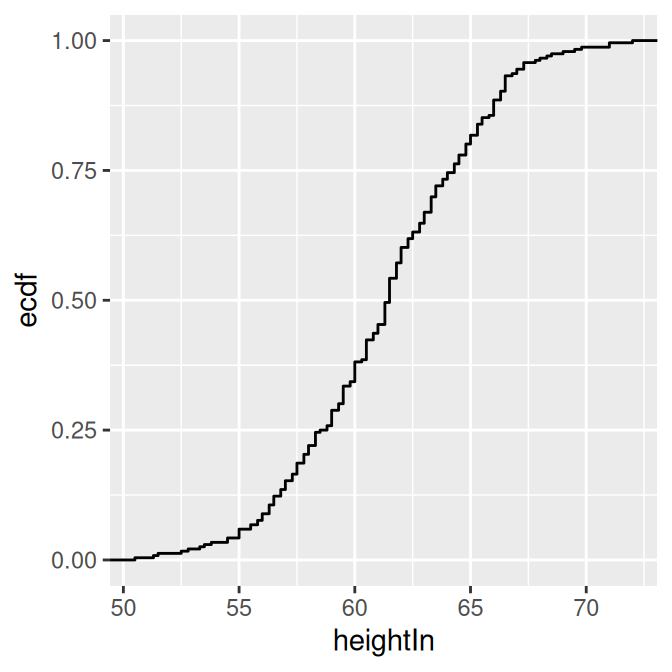
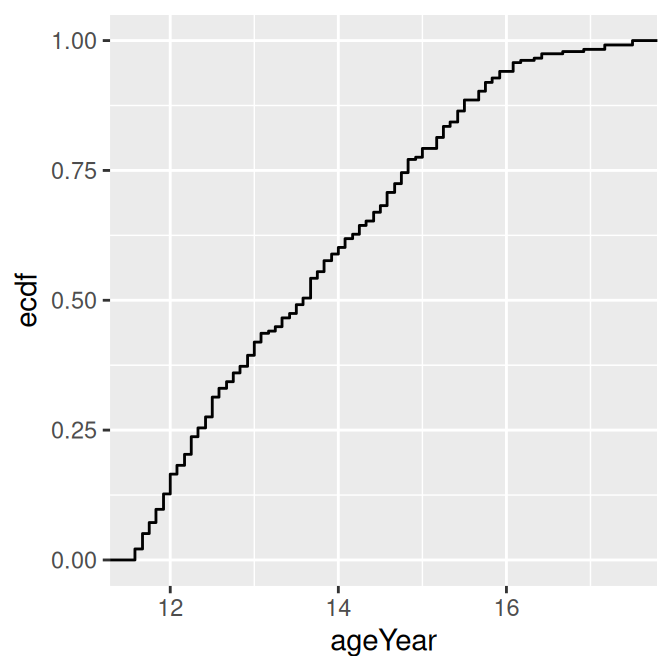
Figure 13.26: ECDF of height (left); ECDF of age (right)