8.3 Reversing a Continuous Axis
8.3.2 Solution
Use scale_y_reverse() or scale_x_reverse() (Figure 8.6). The direction of an axis can also be reversed by specifying the limits in reversed order, with the maximum first, then the minimum:
ggplot(PlantGrowth, aes(x = group, y = weight)) +
  geom_boxplot() +
  scale_y_reverse()

# Similar effect by specifying limits in reversed order
ggplot(PlantGrowth, aes(x = group, y = weight)) +
  geom_boxplot() +
  ylim(6.5, 3.5)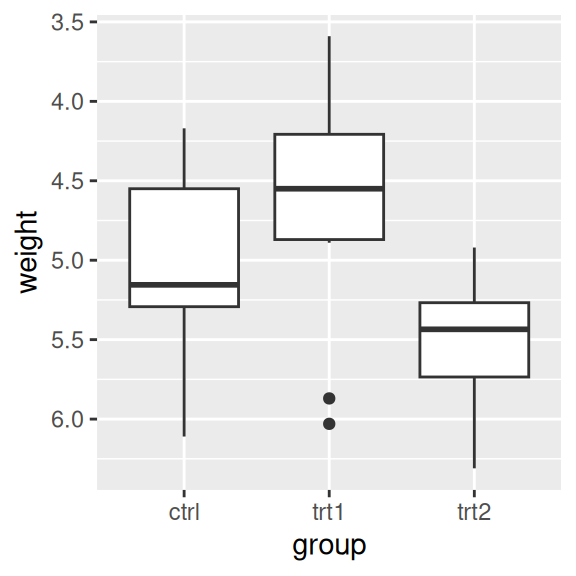
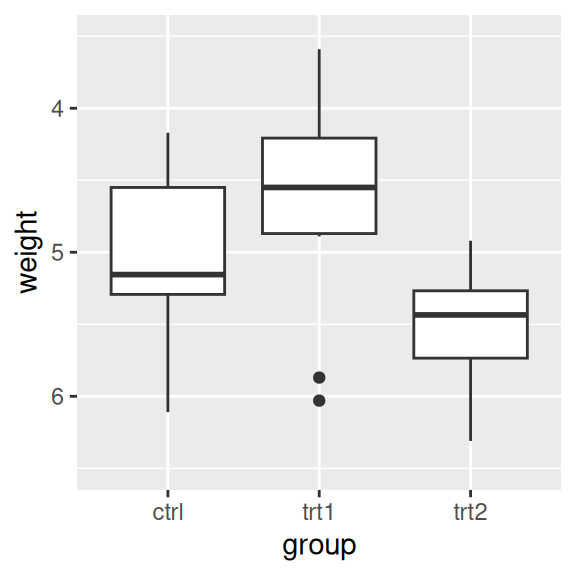
Figure 8.6: Box plot with reversed y-axis
8.3.3 Discussion
Like scale_y_continuous(), scale_y_reverse() does not work with ylim(). (The same is true for the x-axis properties.) If you want to reverse an axis and set its range, you must do it within the scale_y_reverse() statement, by setting the limits in reversed order (Figure 8.7):
ggplot(PlantGrowth, aes(x = group, y = weight)) +
  geom_boxplot() +
  scale_y_reverse(limits = c(8, 0))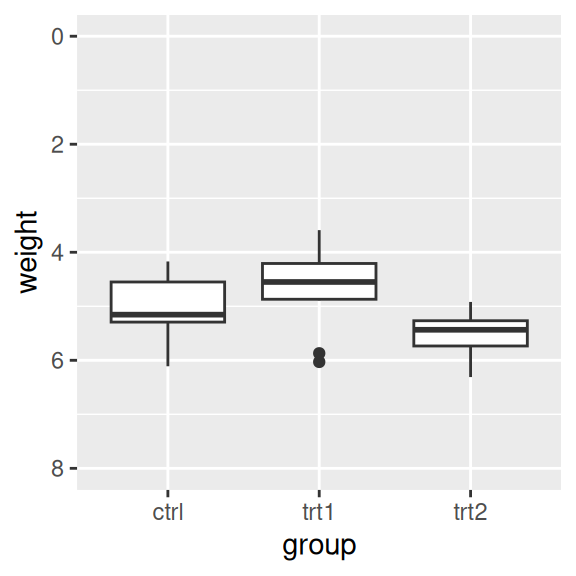
Figure 8.7: Box plot with reversed y-axis with manually set limits
8.3.4 See Also
To reverse the order of items on a discrete axis, see Recipe 8.4.