10.2 Changing the Position of a Legend
10.2.2 Solution
Use theme(legend.position = ...). It can be put on the top, left, right, or bottom by using one of those strings as the position (Figure 10.2, left).
pg_plot <- ggplot(PlantGrowth, aes(x = group, y = weight, fill = group)) +
  geom_boxplot() +
  scale_fill_brewer(palette = "Pastel2")

pg_plot +
  theme(legend.position = "top")
The legend can also be placed inside the plotting area by specifying a coordinate position, as in legend.position = c(.8, .3) (Figure 10.2, right). The coordinate space starts at (0, 0) in the bottom left and goes to (1, 1) in the top right.
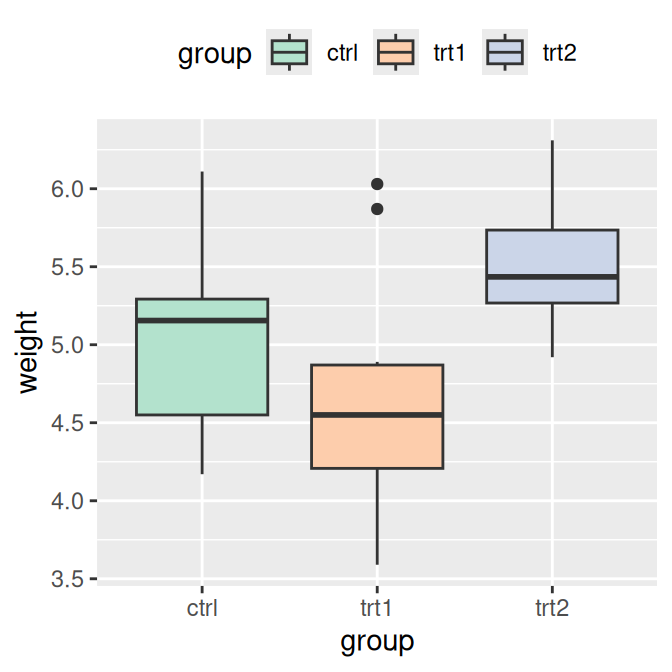
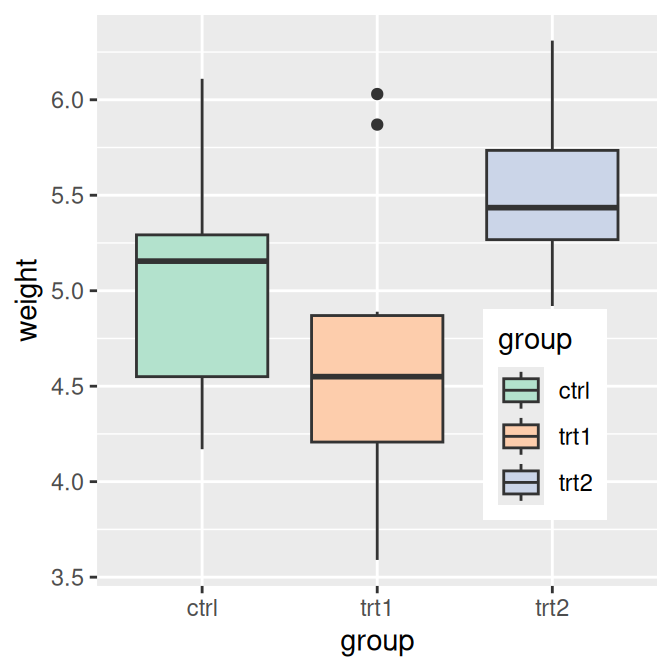
Figure 10.2: Legend on top (left); Legend inside of plotting area (right)
10.2.3 Discussion
You can also use legend.justification to set which part of the legend box is set to the position at legend.position. By default, the center of the legend (.5, .5) is placed at the coordinate, but it is often useful to specify a different point.
For example, this will place the bottom-right corner of the legend (1, 0) in the bottom-right corner of the plotting area (1, 0) (Figure 10.3, left):
And this will place the top-right corner of the legend in the top-right corner of the graphing area (Figure 10.3, right):
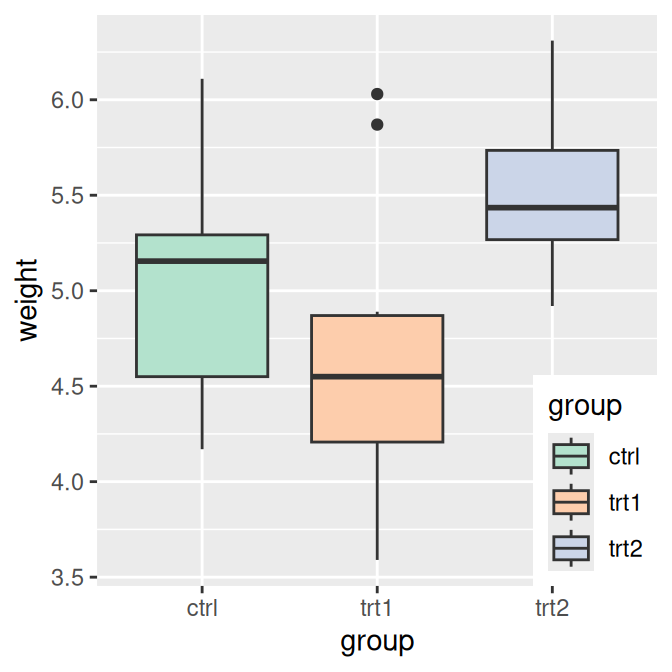
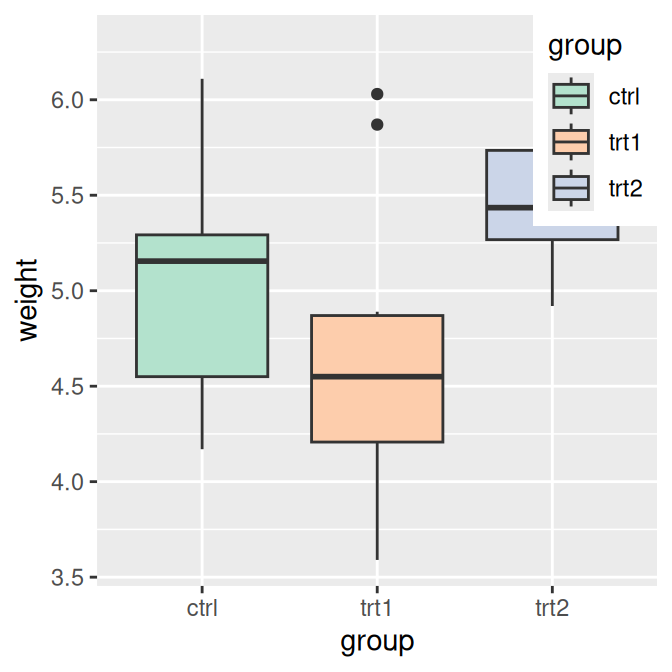
Figure 10.3: Legend in bottom-right corner (left); Legend in top-right corner (right)
When placing the legend inside of the graphing area, it may be helpful to add an opaque border to set it apart (Figure 10.4, left):
pg_plot +
  theme(legend.position = c(.85, .2)) +
  theme(legend.background = element_rect(fill = "white", colour = "black"))
You can also remove the border around its elements so that it blends in (Figure 10.4, right):
pg_plot +
  theme(legend.position = c(.85, .2)) +
  theme(legend.background = element_blank()) +  # Remove overall border
  theme(legend.key = element_blank())           # Remove border around each item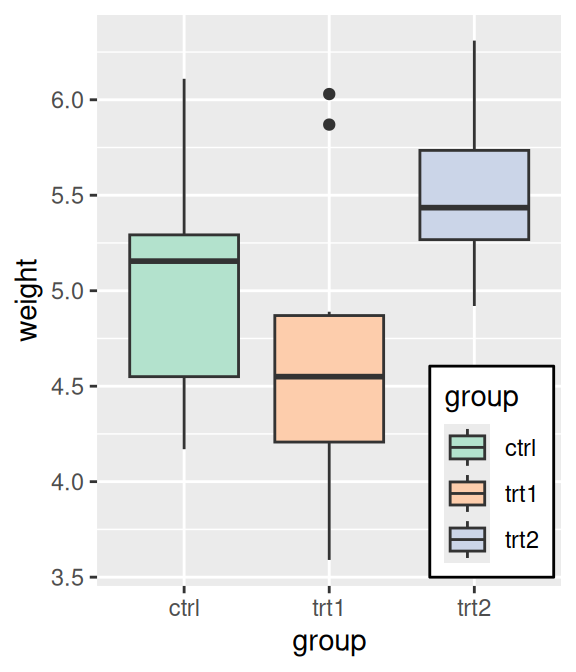
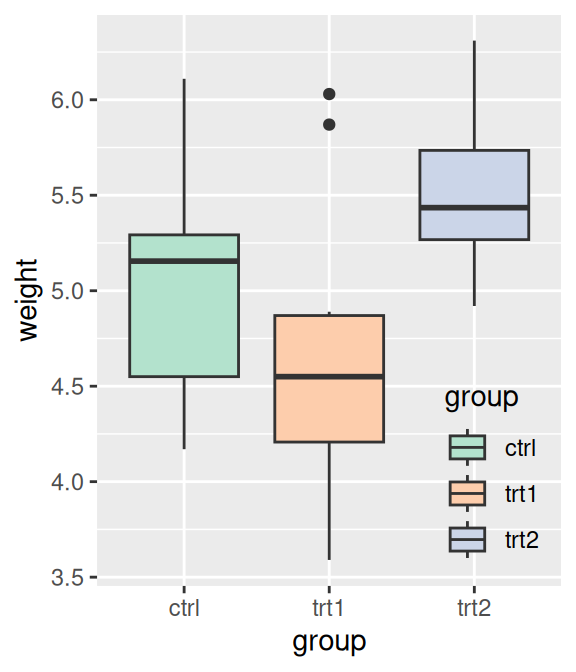
Figure 10.4: Legend with opaque background and outline (left); With no background or outlines (right)