9.6 Hiding Grid Lines
9.6.2 Solution
The major grid lines (those that align with the tick marks) are controlled with panel.grid.major. The minor grid lines (the ones between the major lines) are controlled with panel.grid.minor. This will hide them both, as shown in Figure 9.11 (left):
9.6.3 Discussion
It’s possible to hide just the vertical or horizontal grid lines, as shown in the middle and right-hand graphs in Figure 9.11, with panel.grid.major.x, panel.grid.major.y, panel.grid.minor.x, and panel.grid.minor.y:
# Hide the vertical grid lines (which intersect with the x-axis)
hw_plot +
  theme(
    panel.grid.major.x = element_blank(),
    panel.grid.minor.x = element_blank()
  )

# Hide the horizontal grid lines (which intersect with the y-axis)
hw_plot +
  theme(
    panel.grid.major.y = element_blank(),
    panel.grid.minor.y = element_blank()
  )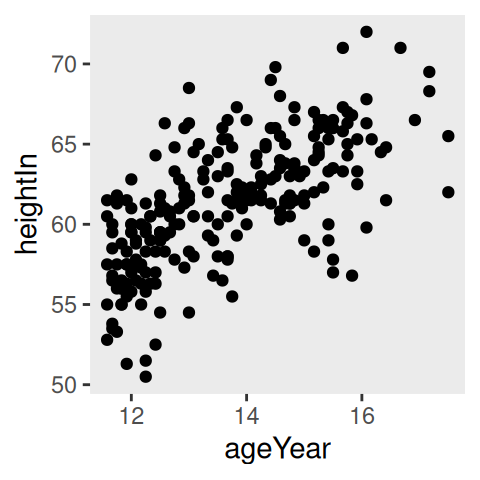


Figure 9.11: No grid lines (left); No vertical lines (middle); No horizontal lines (right)